Technical Analysis of XTWY 2024-05-10
Overview:
In analyzing the technical indicators for XTWY over the last 5 days, we will delve into the trend, momentum, volatility, and volume indicators to provide a comprehensive assessment of the stock's potential price movement. By examining these key factors, we aim to offer valuable insights and predictions for the next few days.
Trend Analysis:
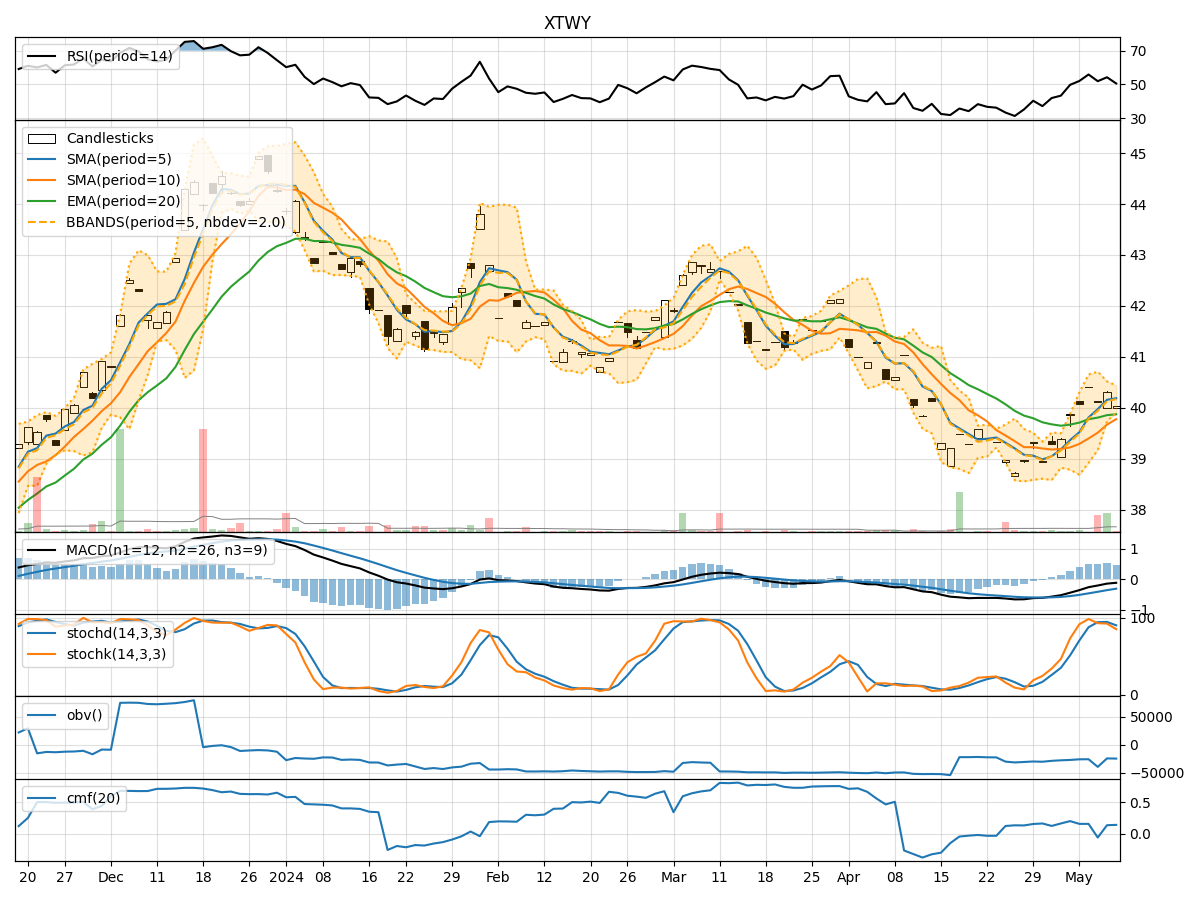
- Moving Averages (MA): The 5-day MA has been consistently above the closing price, indicating a short-term uptrend.
- MACD: The MACD line has been negative but showing signs of convergence with the signal line, suggesting a potential reversal.
- RSI: The RSI has been fluctuating around the neutral zone, indicating indecision in the market sentiment.
Key Observation: The stock is currently in a consolidation phase with mixed signals from trend indicators.
Momentum Analysis:
- Stochastic Oscillator: The Stochastic Oscillator has been fluctuating within the overbought and oversold levels, reflecting a lack of clear momentum direction.
- Williams %R: The Williams %R is in the oversold territory, indicating a potential buying opportunity.
Key Observation: Momentum indicators suggest a lack of strong directional momentum in the stock.
Volatility Analysis:
- Bollinger Bands (BB): The stock price has been trading within the Bollinger Bands, indicating normal volatility levels.
- BB% (Bollinger Band %B): The BB% has been hovering around the midline, suggesting a balanced market sentiment.
Key Observation: Volatility indicators point towards a stable price movement with no extreme fluctuations.
Volume Analysis:
- On-Balance Volume (OBV): The OBV has shown mixed trends, indicating alternating buying and selling pressure.
- Chaikin Money Flow (CMF): The CMF has been positive, suggesting a net inflow of money into the stock.
Key Observation: Volume indicators reflect a balanced accumulation and distribution pattern in the stock.
Conclusion:
Based on the analysis of the technical indicators, the next few days for XTWY are likely to see sideways movement with limited volatility. The stock is currently in a consolidation phase with mixed signals from trend and momentum indicators. Traders may expect the price to range-bound within the current levels, with potential short-term reversals based on the convergence of the MACD lines. It is advisable to closely monitor the price action and wait for clearer signals before making significant trading decisions.
In summary, the overall outlook for XTWY in the next few days is neutral with a slight bias towards consolidation. Investors should exercise caution and wait for more definitive signals before taking any significant positions.