Technical Analysis of XUSP 2024-05-10
Overview:
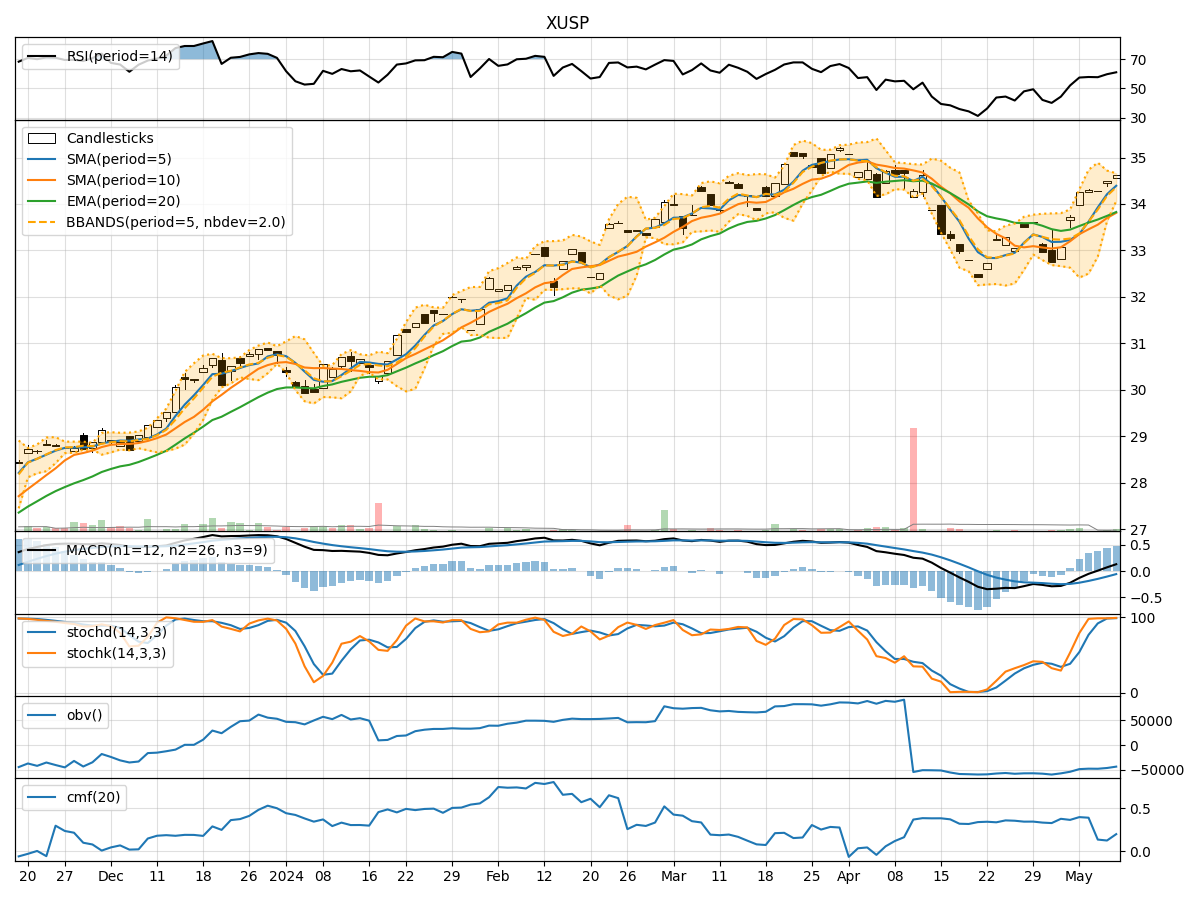
In analyzing the technical indicators for XUSP over the last 5 days, we will delve into the trends, momentum, volatility, and volume aspects to provide a comprehensive outlook on the possible stock price movement. By examining key indicators such as moving averages, MACD, RSI, Bollinger Bands, and OBV, we aim to offer valuable insights and predictions for the upcoming days.
Trend Analysis:
- Moving Averages (MA): The 5-day MA has been consistently above the closing prices, indicating a short-term uptrend.
- MACD: The MACD line has been above the signal line, suggesting bullish momentum.
- EMA: The EMA has been trending upwards, supporting the bullish sentiment.
Key Observation: The trend indicators point towards an upward trajectory for XUSP.
Momentum Analysis:
- RSI: The RSI has been in the overbought territory, indicating strong buying momentum.
- Stochastic Oscillator: Both %K and %D have been in the overbought zone, signaling potential overvaluation.
- Williams %R: The indicator has been consistently showing oversold conditions.
Key Observation: Momentum indicators suggest a potential pullback or consolidation in the near term.
Volatility Analysis:
- Bollinger Bands: The bands have been widening, indicating increased volatility.
- Bollinger %B: The %B has been fluctuating within the bands, reflecting price volatility.
Key Observation: Volatility is on the rise, which could lead to sharp price movements.
Volume Analysis:
- On-Balance Volume (OBV): The OBV has been fluctuating but generally showing a slight decline, suggesting some distribution.
- Chaikin Money Flow (CMF): The CMF has been positive but decreasing, indicating weakening buying pressure.
Key Observation: Volume indicators hint at potential profit-taking or distribution by investors.
Conclusion:
Based on the analysis of trend, momentum, volatility, and volume indicators, the overall outlook for XUSP in the next few days is as follows: - Trend: Upward - Momentum: Potential pullback or consolidation - Volatility: Increasing - Volume: Potential profit-taking or distribution
Final Recommendation:
Considering the mixed signals from momentum and volume indicators alongside the bullish trend and increasing volatility, it is advisable to exercise caution in the short term. Traders may consider taking profits or implementing risk management strategies to navigate the potential market fluctuations. Long-term investors can monitor the price action for a more stable entry point.