Technical Analysis of XVOL 2024-05-10
Overview:
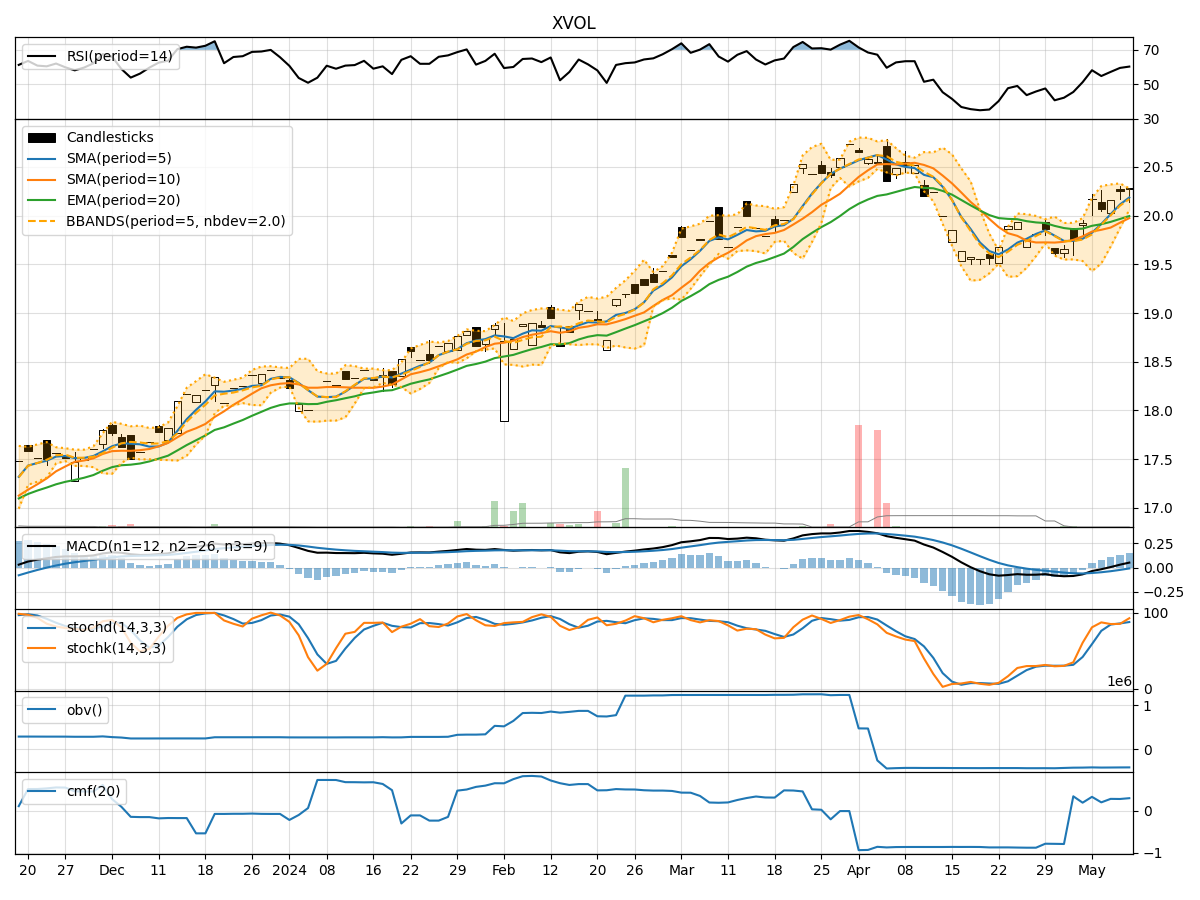
In analyzing the technical indicators for XVOL over the last 5 days, we will delve into the trend, momentum, volatility, and volume indicators to provide a comprehensive outlook on the possible stock price movement in the coming days.
Trend Analysis:
- Moving Averages (MA): The 5-day Moving Average (MA) has been consistently above the Simple Moving Average (SMA) and Exponential Moving Average (EMA), indicating a bullish trend.
- MACD: The MACD line has been consistently above the signal line, with both lines showing an upward trend, suggesting bullish momentum.
- RSI: The Relative Strength Index (RSI) has been hovering around 60-70, indicating a neutral to slightly bullish sentiment.
Momentum Analysis:
- Stochastic Oscillator: Both %K and %D lines of the Stochastic Oscillator have been in the overbought zone, suggesting a potential reversal or consolidation.
- Williams %R: The Williams %R indicator has been fluctuating around oversold levels, indicating a mixed sentiment.
Volatility Analysis:
- Bollinger Bands (BB): The stock price has been trading within the Bollinger Bands, with the bands narrowing, indicating decreasing volatility.
- BB% (Bollinger Band %B): The %B indicator has been hovering around 0.7-0.8, suggesting a bullish sentiment.
Volume Analysis:
- On-Balance Volume (OBV): The OBV indicator has been showing a slight decrease, indicating some distribution.
- Chaikin Money Flow (CMF): The CMF has been positive but trending downwards, signaling potential selling pressure.
Conclusion:
Based on the analysis of the technical indicators, the stock of XVOL is currently in a bullish trend with strong momentum. However, the overbought conditions in the Stochastic Oscillator and potential reversal signals suggest a possible consolidation or minor pullback in the coming days. The decreasing volatility and slight distribution in OBV also support this view.
Recommendation:
- Short-term: Consider taking profits or tightening stop-loss levels as the stock may experience a consolidation phase.
- Long-term: The overall bullish trend remains intact, so any pullback could present a buying opportunity for long-term investors.
Disclaimer:
Remember that technical analysis is not a guaranteed predictor of future price movements, and other fundamental factors can influence stock prices. It is essential to conduct thorough research and consider multiple indicators before making investment decisions. Consulting with a financial advisor is recommended for personalized advice.