Technical Analysis of XXCH 2024-05-10
Overview:
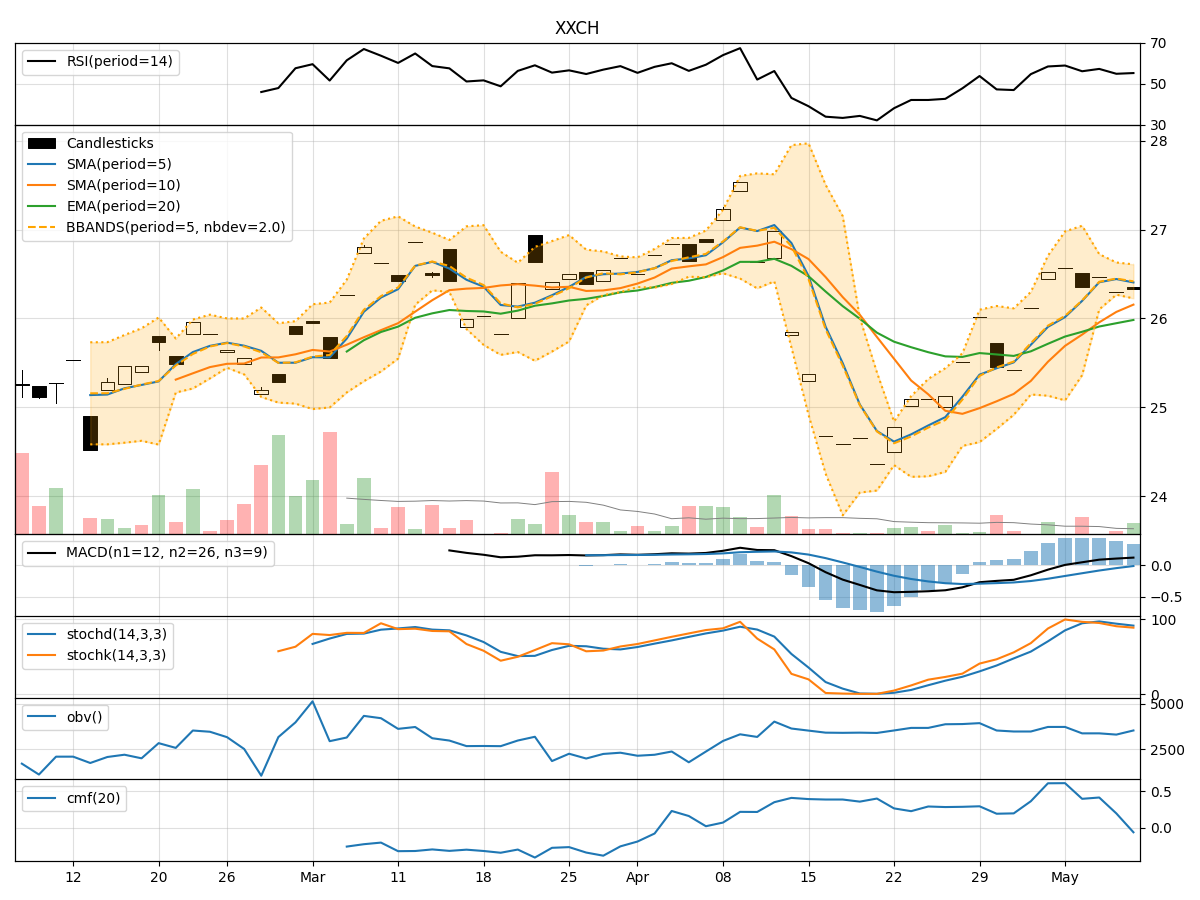
In analyzing the technical indicators for XXCH over the last 5 days, we will delve into the trend, momentum, volatility, and volume indicators to provide a comprehensive outlook on the possible stock price movement in the coming days. By examining key metrics such as moving averages, MACD, RSI, Bollinger Bands, and OBV, we aim to offer valuable insights and recommendations for potential trading strategies.
Trend Indicators Analysis:
- Moving Averages (MA): The 5-day MA has been consistently above the closing prices, indicating a short-term uptrend.
- MACD: The MACD line has been above the signal line, suggesting bullish momentum.
- EMA: The EMA has been trending upwards, supporting the bullish sentiment.
- Conclusion: The trend indicators point towards an upward movement in the stock price.
Momentum Indicators Analysis:
- RSI: The RSI has been fluctuating around the 50 level, indicating a neutral momentum.
- Stochastic Oscillator: Both %K and %D have been declining, signaling a potential reversal.
- Williams %R: The indicator is in oversold territory, suggesting a possible bounce.
- Conclusion: The momentum indicators suggest a sideways to slightly bullish momentum.
Volatility Indicators Analysis:
- Bollinger Bands: The stock price has been trading within the bands, indicating stable volatility.
- Bollinger %B: The %B is hovering around the midline, reflecting equilibrium.
- Conclusion: Volatility indicators imply a consolidation phase in the stock price.
Volume Indicators Analysis:
- On-Balance Volume (OBV): The OBV has shown mixed signals with fluctuations in volume.
- Chaikin Money Flow (CMF): The CMF has been positive but declining, suggesting weakening buying pressure.
- Conclusion: Volume indicators indicate a lack of strong conviction in the recent price movements.
Overall Conclusion:
Based on the analysis of trend, momentum, volatility, and volume indicators, the next few days' possible stock price movement for XXCH is likely to be sideways with a slight upward bias. While the trend indicators support an upward trajectory, the momentum and volume indicators suggest a more cautious outlook. The stock is expected to consolidate within a range, with potential for a modest uptick in price. Traders should exercise caution and consider waiting for clearer signals before making significant trading decisions.