Technical Analysis of XYLE 2024-05-10
Overview:
In analyzing the technical indicators for XYLE over the last 5 days, we will delve into the trend, momentum, volatility, and volume indicators to provide a comprehensive outlook on the possible stock price movement in the coming days.
Trend Indicators:
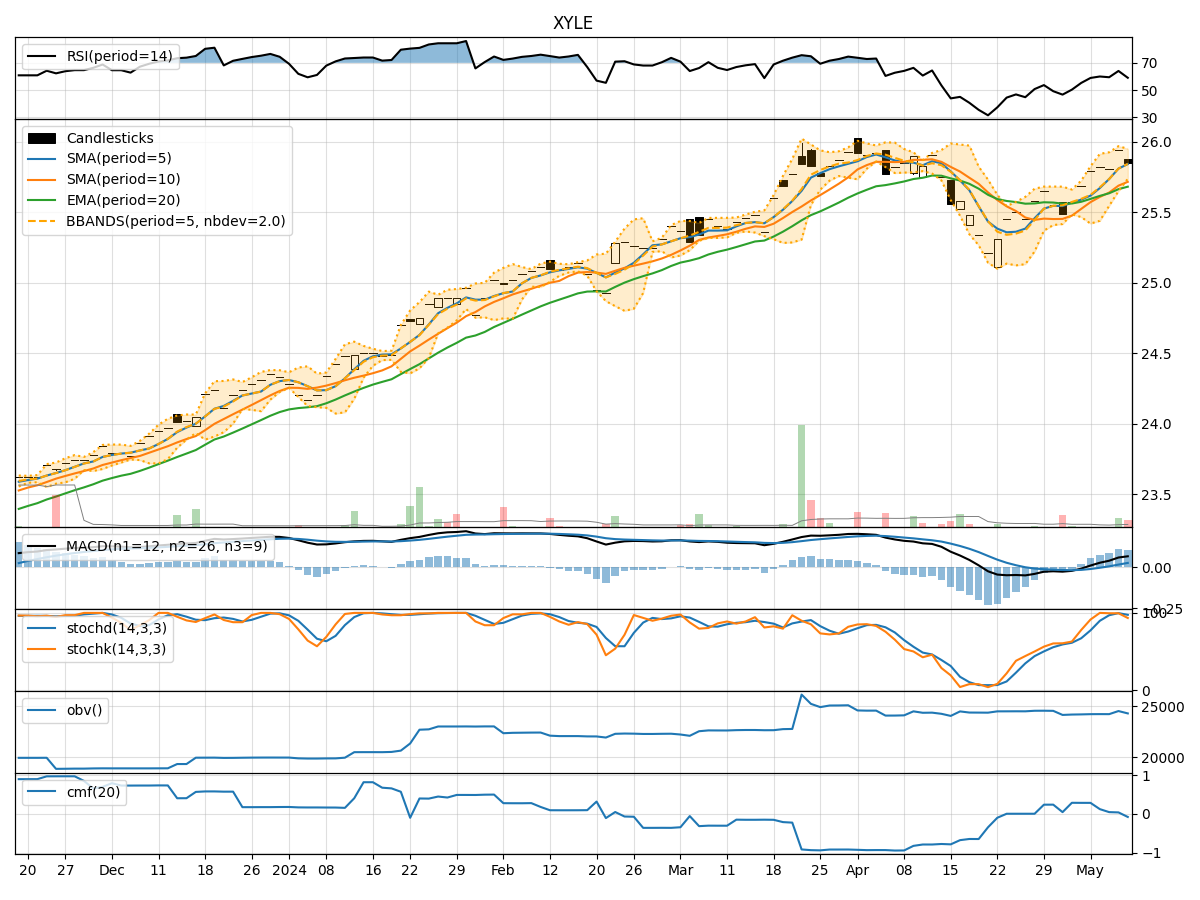
- Moving Averages (MA): The 5-day Moving Average has been consistently above the Simple Moving Average (SMA) and Exponential Moving Average (EMA), indicating a short-term uptrend.
- MACD: The MACD line has been above the signal line, with both lines showing an increasing trend, suggesting bullish momentum.
- MACD Histogram: The MACD Histogram has been consistently positive, indicating upward momentum.
Momentum Indicators:
- RSI: The Relative Strength Index (RSI) has been fluctuating around the 60-70 range, indicating moderate bullish momentum.
- Stochastic Oscillator: Both %K and %D have been in the overbought zone, suggesting a potential reversal or consolidation.
- Williams %R: The Williams %R has been fluctuating, with the last reading indicating an oversold condition.
Volatility Indicators:
- Bollinger Bands: The stock price has been trading within the Bollinger Bands, with the bands narrowing, indicating decreasing volatility.
- Bollinger %B: The %B indicator has been hovering around 0.5, suggesting the stock is trading near the middle of the bands.
Volume Indicators:
- On-Balance Volume (OBV): The OBV has shown a slight increase over the last few days, indicating some accumulation.
- Chaikin Money Flow (CMF): The CMF has been positive but decreasing, suggesting a potential decrease in buying pressure.
Key Observations and Opinions:
- Trend: The trend indicators suggest a bullish bias in the short term, supported by the moving averages and MACD.
- Momentum: The momentum indicators show mixed signals, with the RSI indicating moderate bullish momentum but the Stochastic Oscillator signaling a potential reversal.
- Volatility: Volatility has been decreasing, as indicated by the narrowing Bollinger Bands, which could lead to a period of consolidation.
- Volume: The volume indicators show some accumulation but decreasing buying pressure, indicating a potential slowdown in upward momentum.
Conclusion:
Based on the analysis of the technical indicators, the next few days for XYLE could see sideways movement or a slight pullback as the stock may consolidate within a narrow range. Traders should monitor the Stochastic Oscillator for a potential reversal signal and watch for any breakout or breakdown from the Bollinger Bands for confirmation of the next directional move.