Technical Analysis of YALL 2024-05-10
Overview:
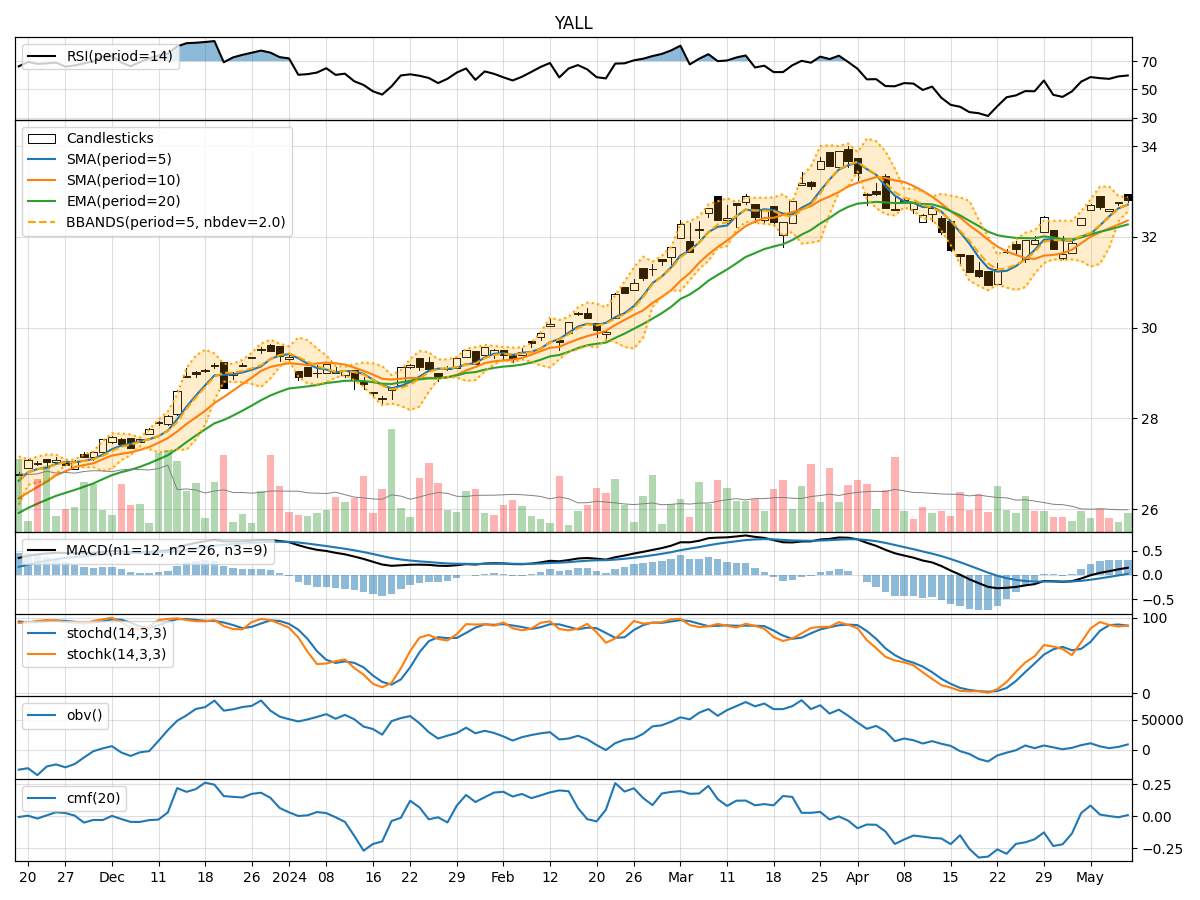
In analyzing the technical indicators for YALL stock over the last 5 days, we will delve into the trend, momentum, volatility, and volume indicators to provide a comprehensive outlook on the possible stock price movement in the coming days.
Trend Analysis:
- Moving Averages (MA): The 5-day Moving Average (MA) has been consistently above the closing prices, indicating an upward trend.
- MACD: The MACD line has been consistently above the signal line, suggesting bullish momentum.
- EMA: The Exponential Moving Average (EMA) has been trending upwards, supporting the bullish sentiment.
Momentum Analysis:
- RSI: The Relative Strength Index (RSI) has been hovering around 60-70, indicating neutral momentum.
- Stochastic Oscillator: Both %K and %D have been fluctuating around 90, suggesting overbought conditions.
- Williams %R: The Williams %R is in the oversold territory, potentially signaling a reversal.
Volatility Analysis:
- Bollinger Bands (BB): The stock price has been trading within the bands, with the bands narrowing, indicating lower volatility.
- Bollinger %B: The %B indicator is around 0.8, suggesting the stock is trading closer to the upper band.
Volume Analysis:
- On-Balance Volume (OBV): The OBV has been fluctuating, indicating mixed buying and selling pressure.
- Chaikin Money Flow (CMF): The CMF has been positive but decreasing, suggesting weakening buying pressure.
Key Observations:
- The trend indicators point towards a bullish bias with moving averages and MACD supporting upward momentum.
- Momentum indicators show a mixed picture with RSI neutral, Stochastic overbought, and Williams %R oversold.
- Volatility indicators suggest lower volatility in the near term.
- Volume indicators indicate mixed sentiment with fluctuating OBV and decreasing CMF.
Conclusion:
Based on the analysis of technical indicators, the next few days for YALL stock could see further upward movement supported by the bullish trend indicators. However, caution is advised as momentum indicators show mixed signals with potential overbought conditions. Volatility is expected to remain low, but volume indicators suggest a lack of strong buying pressure. Traders should monitor price action closely for any signs of a reversal or consolidation.
Recommendation:
- Short-term Traders: Consider taking profits on any significant price increases due to potential overbought conditions.
- Long-term Investors: Hold positions but monitor closely for any signs of a trend reversal.
- Risk Management: Implement stop-loss orders to protect gains and manage risk effectively.
In conclusion, while the overall outlook is bullish, it is essential to remain vigilant and adapt to changing market conditions to make informed trading decisions.