Technical Analysis of YBTC 2024-05-10
Overview:
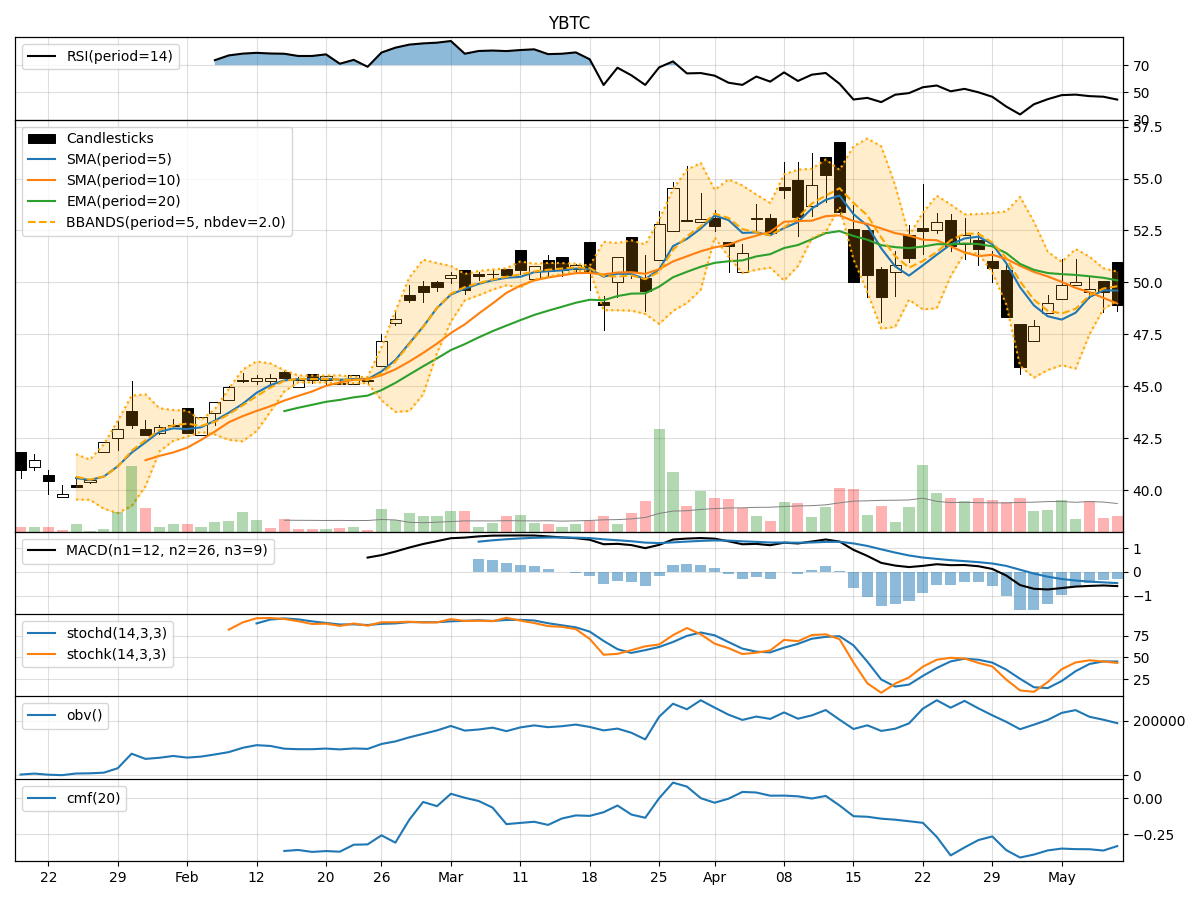
In analyzing the technical indicators for YBTC over the last 5 days, we will delve into the trend, momentum, volatility, and volume indicators to provide a comprehensive outlook on the possible stock price movement in the coming days. By examining key metrics such as moving averages, MACD, RSI, Bollinger Bands, and OBV, we aim to offer valuable insights and predictions for informed decision-making.
Trend Indicators:
- Moving Averages (MA): The 5-day MA has been fluctuating around the closing prices, indicating short-term price trends. The SMA(10) and EMA(20) have shown a slight decline, suggesting a weakening trend.
- MACD: The MACD line has been negative, with the MACD histogram showing a decreasing trend over the past 5 days.
- Conclusion: The trend indicators point towards a downward trend in the stock price.
Momentum Indicators:
- RSI: The RSI has been declining, indicating a decrease in buying momentum.
- Stochastic Oscillator: Both %K and %D have been trending downwards, signaling a potential reversal in momentum.
- Conclusion: Momentum indicators suggest a bearish sentiment in the stock.
Volatility Indicators:
- Bollinger Bands: The stock price has been trading within the lower Bollinger Band, indicating lower volatility.
- Conclusion: Volatility indicators suggest a sideways movement or a period of consolidation.
Volume Indicators:
- On-Balance Volume (OBV): The OBV has been decreasing, reflecting a decrease in buying pressure.
- Chaikin Money Flow (CMF): The CMF has been negative, indicating a lack of buying interest.
- Conclusion: Volume indicators point towards a bearish sentiment in the stock.
Overall Conclusion:
Based on the analysis of trend, momentum, volatility, and volume indicators, the next few days' possible stock price movement for YBTC is likely to be downward. The trend indicators show a weakening trend, momentum indicators suggest a bearish sentiment, and volume indicators reflect a decrease in buying pressure. While volatility indicators indicate a sideways movement, the overall outlook remains negative. Investors should exercise caution and consider potential short-selling opportunities or wait for a more favorable entry point.
Key Recommendations:
- Short-Term Traders: Consider short-selling or adopting a bearish strategy based on the current trend and momentum indicators.
- Long-Term Investors: Monitor the stock closely and wait for a more favorable entry point before considering any long positions.
- Risk Management: Implement strict stop-loss orders to mitigate potential losses in case of adverse price movements.
By combining insights from various technical indicators, investors can make well-informed decisions aligned with the prevailing market dynamics. Remember to stay updated on the latest market developments and adjust your strategy accordingly to navigate the stock market effectively.