Technical Analysis of YDEC 2024-05-10
Overview:
In analyzing the technical indicators for YDEC stock over the last 5 days, we will delve into the trend, momentum, volatility, and volume indicators to provide a comprehensive outlook on the possible stock price movement in the coming days. By examining these key indicators, we aim to offer valuable insights and predictions for potential investors.
Trend Analysis:
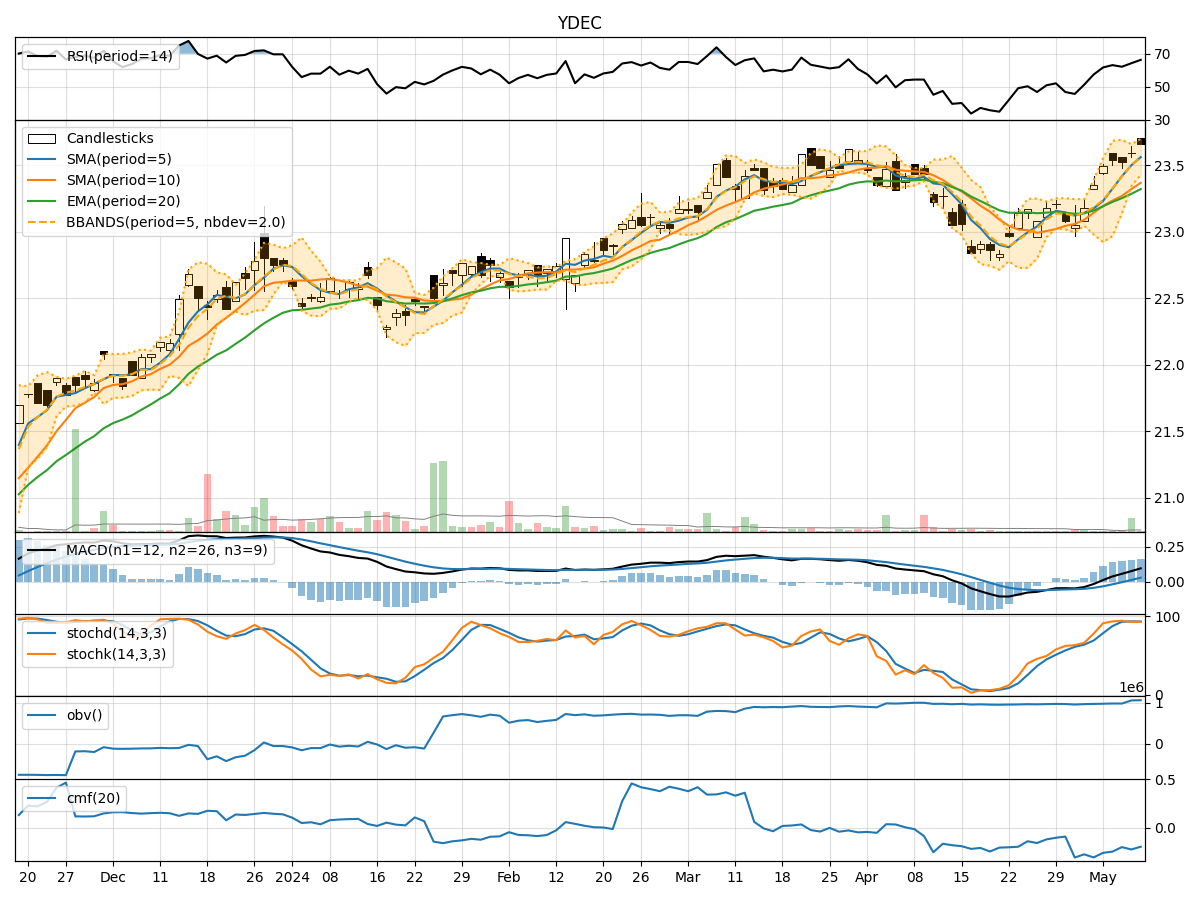
- Moving Averages (MA): The 5-day moving average has been consistently above the simple moving average (SMA) and exponential moving average (EMA), indicating a bullish trend.
- MACD: The MACD line has been consistently above the signal line, suggesting a positive momentum in the stock price.
Momentum Analysis:
- RSI: The Relative Strength Index (RSI) has been trending upwards, indicating increasing buying pressure.
- Stochastic Oscillator: Both %K and %D have been in the overbought zone, suggesting a potential reversal or consolidation.
Volatility Analysis:
- Bollinger Bands (BB): The stock price has been trading within the upper Bollinger Band, indicating high volatility.
Volume Analysis:
- On-Balance Volume (OBV): The OBV has shown a slight increase, suggesting accumulation by investors.
- Chaikin Money Flow (CMF): The CMF has been negative, indicating selling pressure in the stock.
Key Observations:
- The trend indicators suggest a bullish sentiment in the stock price.
- Momentum indicators show a potential overbought condition, signaling a need for caution.
- Volatility remains high, as indicated by the Bollinger Bands.
- Volume indicators reflect mixed signals with slight accumulation but overall selling pressure.
Conclusion:
Based on the analysis of the technical indicators, the stock price of YDEC is likely to experience a short-term consolidation or pullback due to the overbought conditions in the momentum indicators and high volatility. Investors should exercise caution and consider waiting for a better entry point before initiating new positions. A sideways movement or a slight downward correction is anticipated in the next few days. It is advisable to monitor the price action closely and wait for clearer signals before making any significant trading decisions.