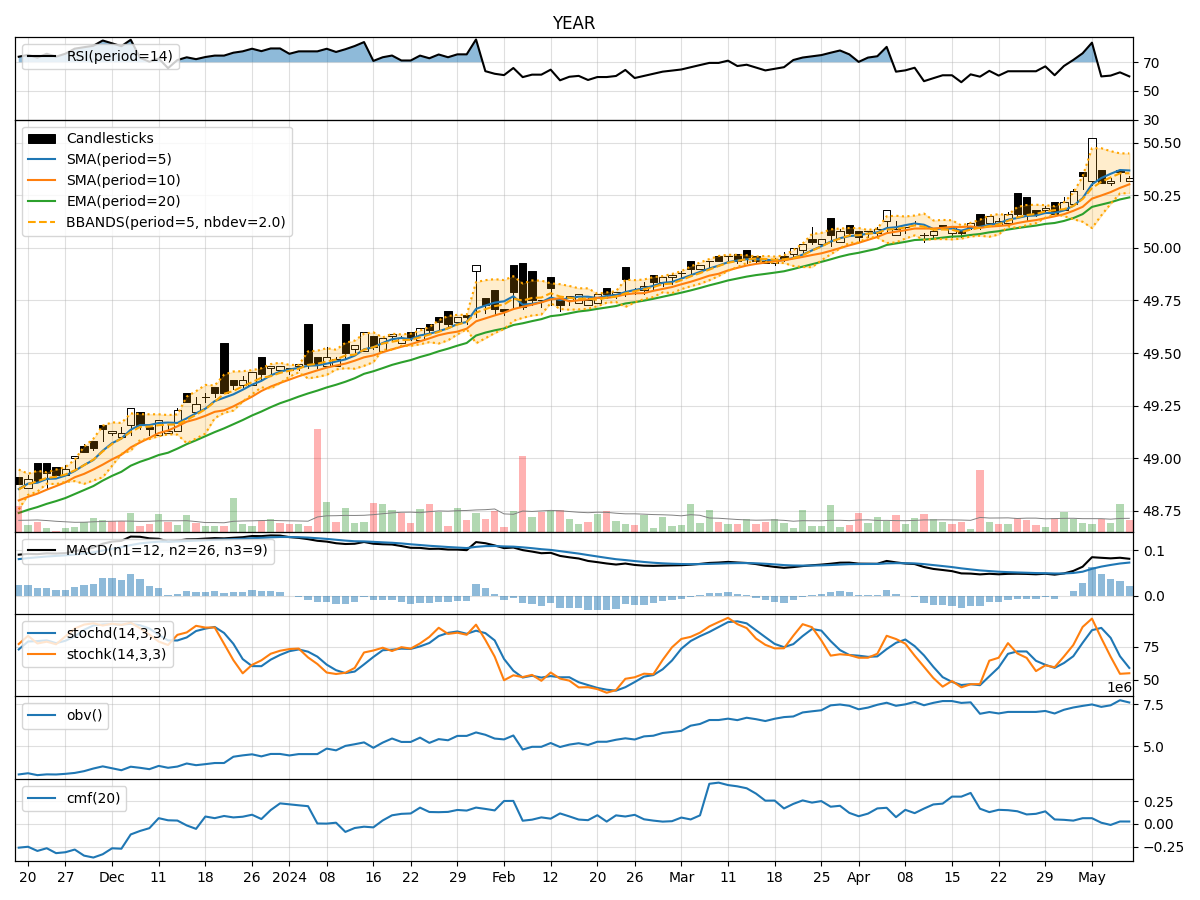
Technical Analysis of YEAR 2024-05-10
Overview:
In the last 5 trading days, the stock has shown a relatively stable price movement with minor fluctuations. The trend indicators suggest a slight uptrend, supported by moving averages and MACD values. Momentum indicators indicate a mixed sentiment, with RSI showing overbought conditions on some days. Volatility indicators show a narrowing Bollinger Bands, indicating decreasing volatility. Volume indicators suggest a positive accumulation/distribution trend.
Trend Indicators:
- Moving Averages (MA): The 5-day MA has been consistently above the closing price, indicating a short-term uptrend.
- MACD: The MACD line has been positive, indicating bullish momentum.
- MACD Histogram: The histogram has been above the zero line, suggesting increasing bullish momentum.
Key Observation: The trend indicators overall suggest a bullish sentiment in the short term.
Momentum Indicators:
- RSI: The RSI values have been fluctuating but generally staying in the overbought territory, indicating a strong buying pressure.
- Stochastic Oscillator: The Stochastic indicators have shown mixed signals, with some days in overbought territory and others in oversold territory.
Key Observation: Momentum indicators are showing a mixed sentiment, with RSI indicating overbought conditions.
Volatility Indicators:
- Bollinger Bands (BB): The Bollinger Bands have been narrowing, suggesting decreasing volatility and a possible period of consolidation.
- Bollinger %B (BBP): The %B values have been decreasing, indicating the price is closer to the lower band.
Key Observation: Volatility indicators suggest a consolidation phase with decreasing volatility.
Volume Indicators:
- On-Balance Volume (OBV): The OBV values have been increasing, indicating positive accumulation.
- Chaikin Money Flow (CMF): The CMF values have been positive, suggesting buying pressure.
Key Observation: Volume indicators show positive accumulation and buying pressure.
Conclusion:
Based on the analysis of the technical indicators, the stock is likely to experience sideways movement in the next few days. The trend indicators point towards a short-term bullish sentiment, supported by moving averages and MACD. However, the mixed momentum signals, with RSI in overbought territory, suggest a possible consolidation phase. The narrowing Bollinger Bands and positive volume indicators further support the view of a sideways movement with a potential for a slight upward bias.
Overall Assessment: The stock is expected to consolidate in the near term, with a potential for a slight upward movement. Traders may consider waiting for clearer signals or adopting a range-bound trading strategy.