Technical Analysis of YJUN 2024-05-10
Overview:
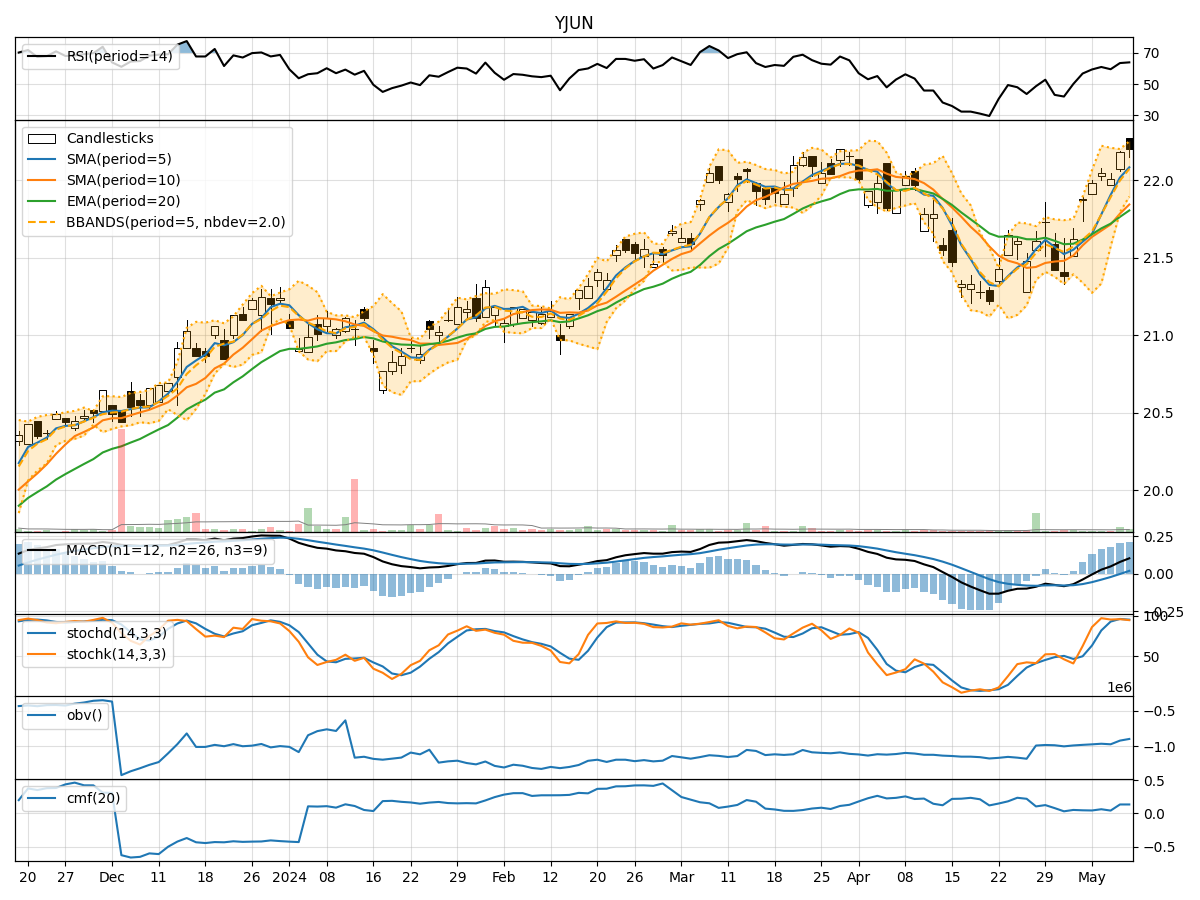
In analyzing the technical indicators for YJUN stock over the last 5 days, we will delve into the trend, momentum, volatility, and volume indicators to provide a comprehensive outlook on the possible stock price movement in the coming days. By examining these key indicators, we aim to offer valuable insights and predictions to guide your investment decisions.
Trend Analysis:
- Moving Averages (MA): The 5-day Moving Average (MA) has been consistently above the Simple Moving Average (SMA) and Exponential Moving Average (EMA), indicating a bullish trend.
- MACD: The MACD line has been consistently above the signal line, with both lines showing an upward trend, suggesting bullish momentum.
- MACD Histogram: The MACD Histogram has been increasing over the past 5 days, indicating strengthening bullish momentum.
Momentum Analysis:
- RSI: The Relative Strength Index (RSI) has been trending upwards and is currently in the overbought territory, suggesting a strong bullish momentum.
- Stochastic Oscillator: Both %K and %D lines of the Stochastic Oscillator are in the overbought zone, indicating a potential reversal or consolidation.
- Williams %R: The Williams %R is in the oversold region, signaling a potential buying opportunity.
Volatility Analysis:
- Bollinger Bands (BB): The stock price has been trading within the Bollinger Bands, with the bands narrowing, indicating decreasing volatility.
- Bollinger Band %B: The %B indicator is hovering around 0.8, suggesting the stock is trading close to the upper band.
Volume Analysis:
- On-Balance Volume (OBV): The OBV indicator has been trending upwards, indicating accumulation by investors.
- Chaikin Money Flow (CMF): The CMF is positive and has been increasing, suggesting strong buying pressure.
Key Observations:
- The trend indicators suggest a strong bullish sentiment, supported by the moving averages and MACD.
- Momentum indicators indicate overbought conditions, which may lead to a potential reversal or consolidation.
- Volatility has been decreasing, indicating a possible period of consolidation or sideways movement.
- Volume indicators show increasing buying pressure, supporting the bullish outlook.
Conclusion:
Based on the analysis of the technical indicators, the next few days for YJUN stock are likely to see continued upward movement in the stock price. However, caution is advised as the momentum indicators signal potential overbought conditions, which could lead to a short-term correction or consolidation. Investors should closely monitor the price action and key support levels to assess the sustainability of the bullish trend. Overall, the outlook remains bullish with a potential for a short-term pullback before resuming the upward trajectory.