Technical Analysis of YLDE 2024-05-10
Overview:
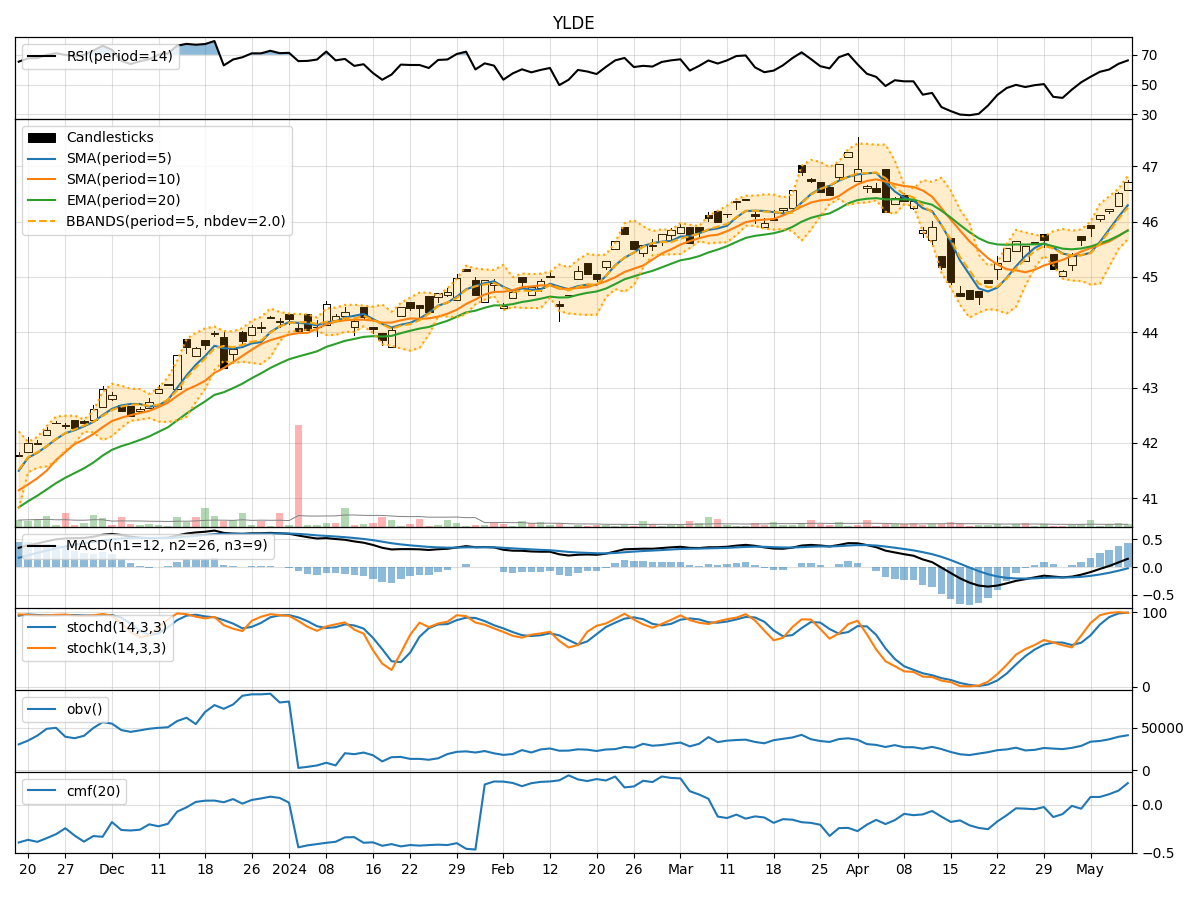
In analyzing the technical indicators for YLDE over the last 5 days, we will delve into the trend, momentum, volatility, and volume indicators to provide a comprehensive outlook on the possible stock price movement in the coming days. By examining these key aspects, we aim to offer valuable insights and predictions to guide your investment decisions.
Trend Analysis:
- Moving Averages (MA): The 5-day Moving Average (MA) has been consistently above the Simple Moving Average (SMA) and Exponential Moving Average (EMA), indicating a bullish trend.
- MACD: The MACD line has been consistently above the signal line, with both lines trending upwards, suggesting a bullish momentum.
- MACD Histogram: The MACD Histogram has been increasing, indicating strengthening bullish momentum.
Momentum Analysis:
- RSI: The Relative Strength Index (RSI) has been trending upwards and is currently in the overbought territory, signaling a strong bullish momentum.
- Stochastic Oscillator: Both %K and %D lines of the Stochastic Oscillator are in the overbought zone, indicating a strong bullish momentum.
- Williams %R: The Williams %R is in the oversold territory, suggesting a potential reversal in the bullish momentum.
Volatility Analysis:
- Bollinger Bands (BB): The stock price has been consistently trading above the middle Bollinger Band (BBM), indicating an upward trend.
- Bollinger Band Width (BBW): The Bollinger Band Width has been narrowing, suggesting a decrease in volatility.
- Bollinger Band %B (BBP): The %B indicator is above 0.5, indicating a bullish trend.
Volume Analysis:
- On-Balance Volume (OBV): The OBV has been steadily increasing, reflecting strong buying pressure in the stock.
- Chaikin Money Flow (CMF): The CMF is positive and has been trending upwards, indicating accumulation by investors.
Conclusion:
Based on the analysis of the technical indicators, the stock of YLDE is exhibiting strong bullish signals across trend, momentum, volatility, and volume indicators. The moving averages, MACD, RSI, Stochastic Oscillator, and OBV all point towards a continuation of the upward trend in the stock price. The narrowing Bollinger Band Width and positive CMF further support the bullish outlook.