Technical Analysis of YMAG 2024-05-10
Overview:
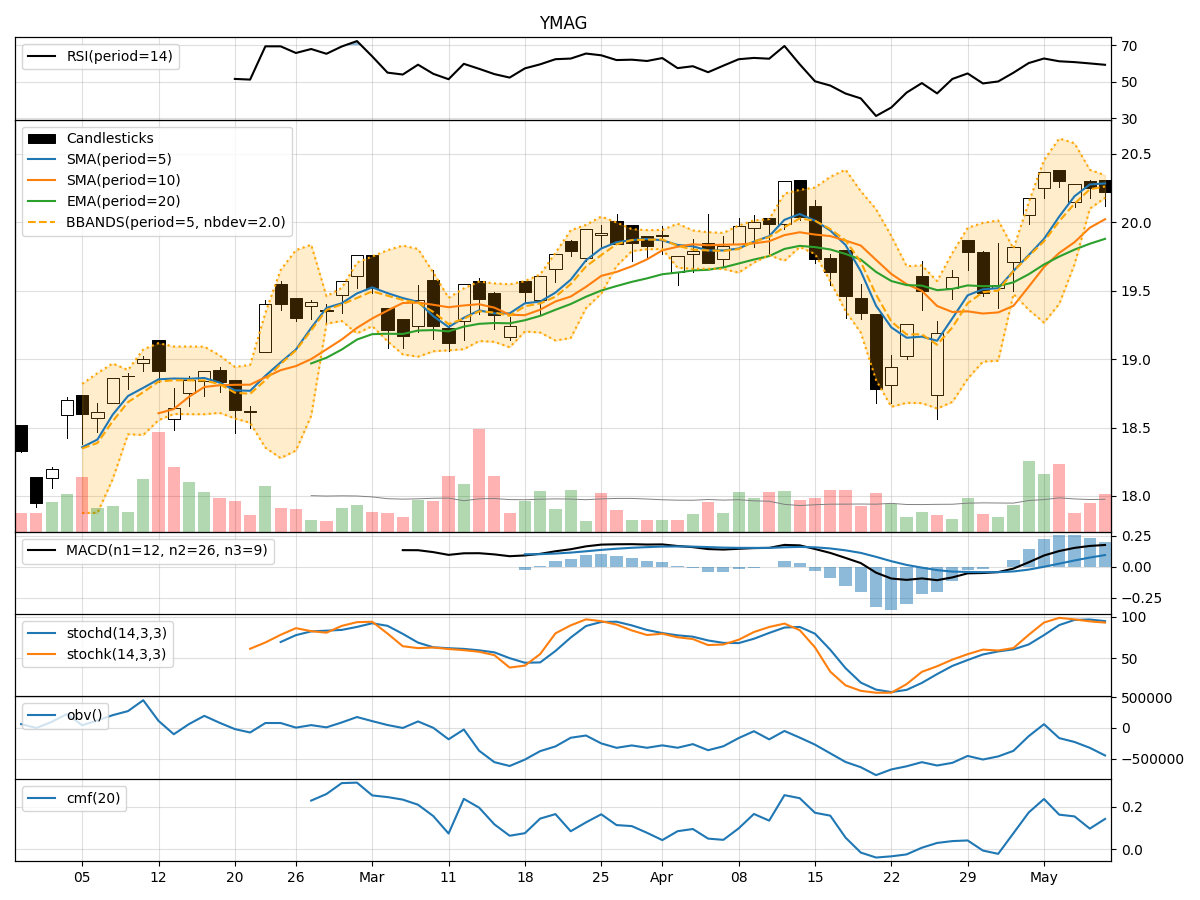
In analyzing the technical indicators for YMAG over the last 5 days, we will delve into the trend, momentum, volatility, and volume indicators to provide a comprehensive outlook on the possible stock price movement in the coming days.
Trend Indicators:
- Moving Averages (MA): The 5-day MA has been consistently above the closing prices, indicating a bullish trend.
- MACD: The MACD line has been above the signal line, suggesting a bullish momentum.
- RSI: The RSI has been hovering around 60-65, indicating a neutral to slightly bullish sentiment.
Key Observation: The trend indicators suggest a bullish bias in the short term.
Momentum Indicators:
- Stochastic Oscillator: The Stochastic K and D lines have been in the overbought territory, signaling a potential reversal.
- Williams %R (WillR): The WillR indicator has been consistently in the oversold region, indicating a bearish sentiment.
Key Observation: Momentum indicators show conflicting signals, with Stochastic suggesting a possible pullback while WillR indicates a bearish outlook.
Volatility Indicators:
- Bollinger Bands (BB): The stock price has been trading within the bands, indicating a period of consolidation.
- Average True Range (ATR): ATR has been relatively stable, suggesting consistent volatility levels.
Key Observation: Volatility indicators point towards a period of consolidation and stability in price movement.
Volume Indicators:
- On-Balance Volume (OBV): The OBV has been declining, indicating selling pressure in the stock.
- Chaikin Money Flow (CMF): CMF has been fluctuating around the zero line, suggesting a balance between buying and selling pressure.
Key Observation: Volume indicators reflect a bearish sentiment with decreasing OBV and neutral CMF readings.
Conclusion:
Based on the analysis of the technical indicators, the next few days' possible stock price movement for YMAG is likely to be sideways with a slight bearish bias. The trend indicators support a bullish outlook in the short term, while momentum indicators show conflicting signals with a potential for a pullback. Volatility indicators point towards a period of consolidation, and volume indicators indicate a bearish sentiment with selling pressure.
Overall, the stock is expected to trade within a range with a downward bias, and investors should exercise caution and closely monitor key support and resistance levels for potential trading opportunities.