Technical Analysis of YMAX 2024-05-10
Overview:
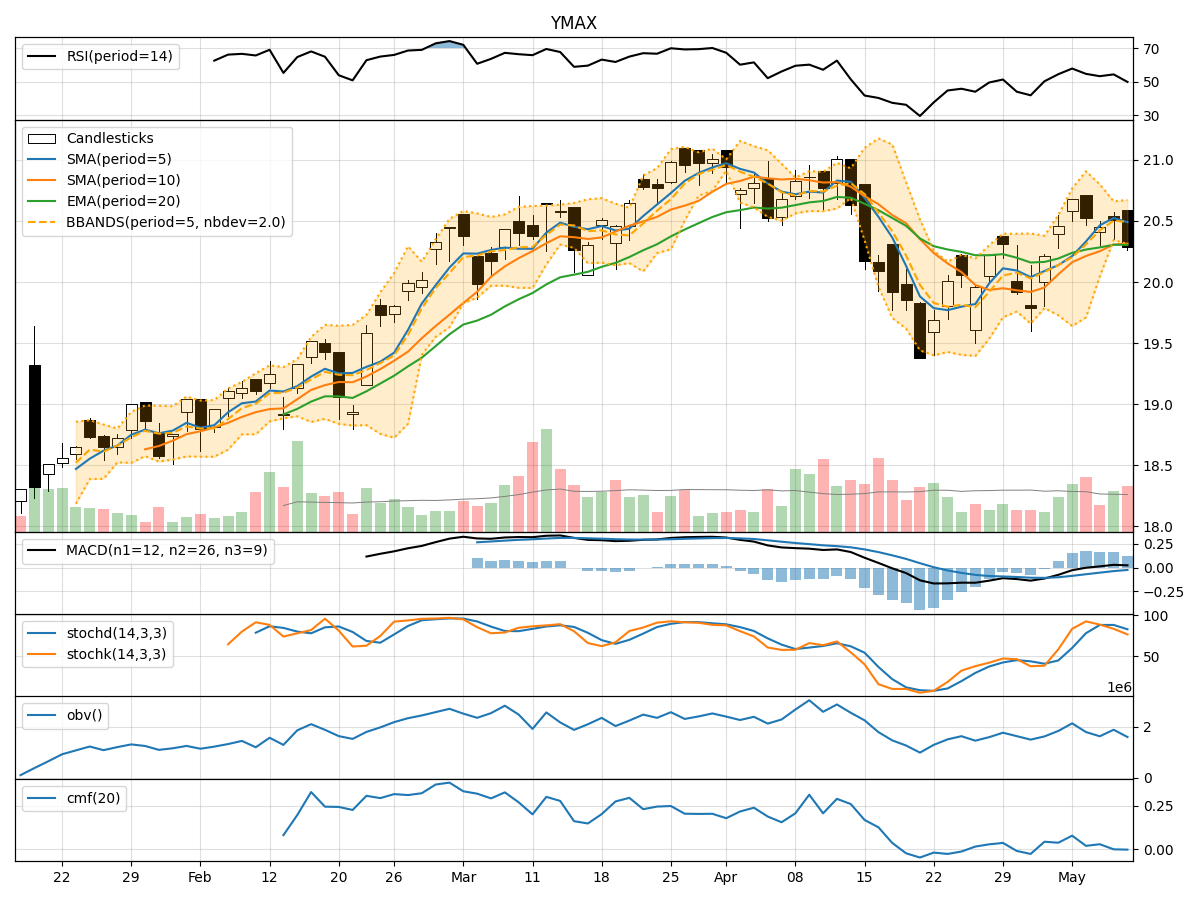
In analyzing the technical indicators for YMAX over the last 5 days, we will delve into the trends, momentum, volatility, and volume aspects to provide a comprehensive outlook on the possible stock price movement in the coming days. By examining key indicators such as moving averages, MACD, RSI, Bollinger Bands, and OBV, we aim to offer valuable insights and predictions for potential price action.
Trend Analysis:
- Moving Averages (MA): The 5-day MA has been trending slightly above the closing prices, indicating a short-term uptrend.
- MACD: The MACD line has been consistently positive, suggesting bullish momentum.
- EMA: The EMA has been trending upwards, supporting the bullish sentiment.
Key Observation: The trend indicators point towards an upward trajectory for YMAX.
Momentum Analysis:
- RSI: The RSI has been fluctuating around the mid-level, indicating a balanced momentum.
- Stochastic Oscillator: Both %K and %D have been gradually decreasing, signaling a potential shift towards oversold conditions.
- Williams %R: The indicator has been in the oversold territory, suggesting a possible reversal.
Key Observation: Momentum indicators suggest a neutral to slightly bearish outlook for YMAX.
Volatility Analysis:
- Bollinger Bands (BB): The stock price has been trading within the bands, indicating moderate volatility.
- BB Width: The bands have shown slight contraction, suggesting a potential decrease in volatility.
Key Observation: Volatility indicators imply a stable price movement for YMAX.
Volume Analysis:
- On-Balance Volume (OBV): The OBV has shown mixed signals with fluctuations, indicating indecision among investors.
- Chaikin Money Flow (CMF): The CMF has been hovering around the zero line, reflecting a lack of strong buying or selling pressure.
Key Observation: Volume indicators reflect uncertainty in market sentiment for YMAX.
Conclusion:
Based on the analysis of trend, momentum, volatility, and volume indicators, the overall outlook for YMAX in the next few days is as follows:
- Trend: Upward
- Momentum: Neutral to slightly bearish
- Volatility: Stable
- Volume: Uncertain
Final Verdict:
Considering the mixed signals from momentum and volume indicators, alongside the stable volatility and bullish trend, it is likely that YMAX may experience sideways consolidation in the near term. Traders should exercise caution and closely monitor key levels for potential breakout or reversal opportunities.