Technical Analysis of YOLO 2024-05-10
Overview:
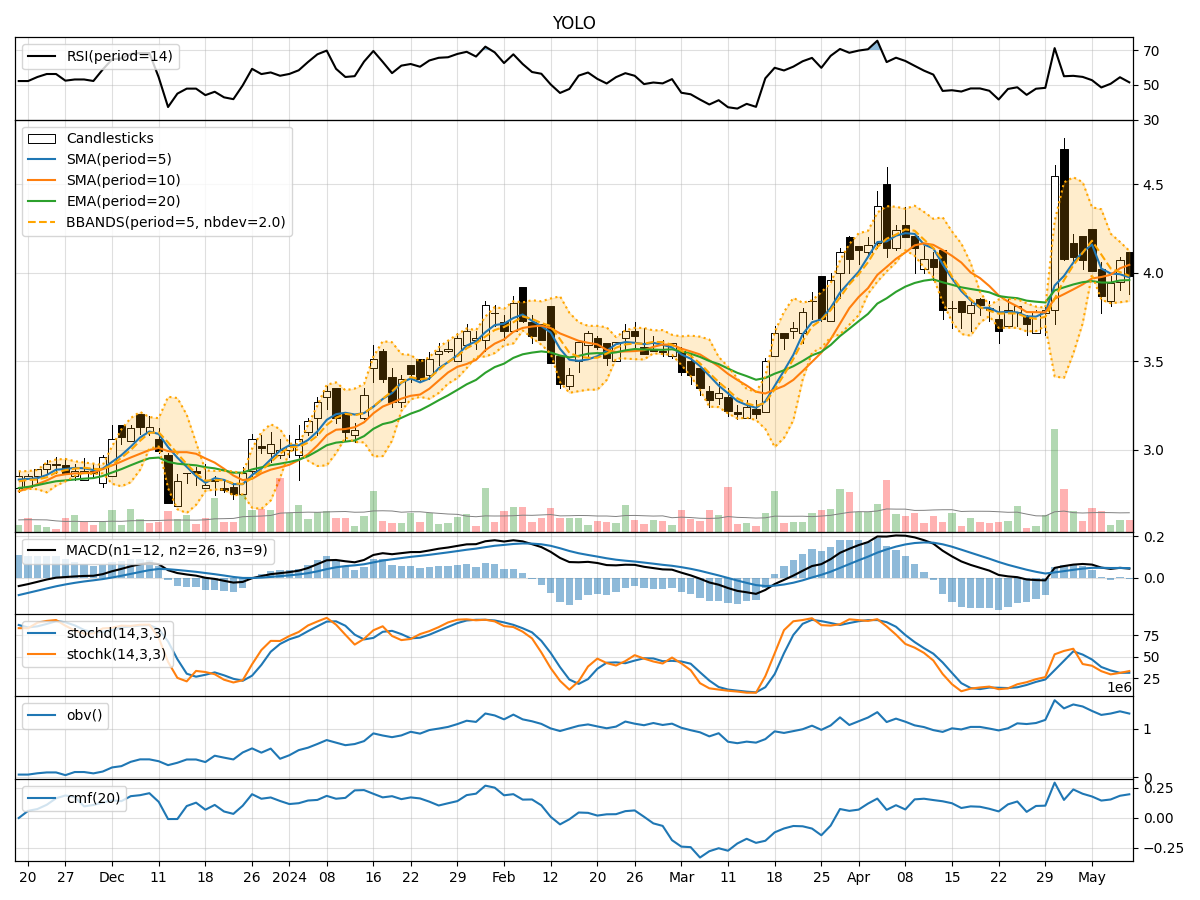
In analyzing the technical indicators for YOLO stock over the last 5 days, we will delve into the trend, momentum, volatility, and volume indicators to provide a comprehensive outlook on the possible stock price movement in the coming days. By examining these key indicators, we aim to offer valuable insights and predictions for potential investors.
Trend Indicators:
- Moving Averages (MA): The 5-day MA has been consistently below the closing prices, indicating a short-term downtrend.
- MACD: The MACD line has been fluctuating around the signal line, suggesting indecision in the market momentum.
- EMA: The EMA has been relatively flat, reflecting a lack of strong trend direction.
Key Observation: The trend indicators show a lack of clear direction in the stock's movement, with a slight bearish bias.
Momentum Indicators:
- RSI: The RSI has been hovering around the mid-level, indicating a balanced momentum between buying and selling pressure.
- Stochastic Oscillator: Both %K and %D have been fluctuating in the oversold territory, suggesting a potential reversal.
- Williams %R: The indicator has been in the oversold region, signaling a possible buying opportunity.
Key Observation: Momentum indicators suggest a potential reversal or consolidation in the stock price.
Volatility Indicators:
- Bollinger Bands (BB): The bands have been narrowing, indicating decreasing volatility.
- BB %B: The %B has been below 0.5, suggesting the stock is trading below the lower band.
- Average True Range (ATR): ATR has been decreasing, indicating reduced price volatility.
Key Observation: Volatility indicators point towards a period of low volatility and potential price consolidation.
Volume Indicators:
- On-Balance Volume (OBV): The OBV has shown mixed movements, reflecting uncertainty in the buying and selling pressure.
- Chaikin Money Flow (CMF): The CMF has been positive but relatively flat, indicating a neutral money flow trend.
Key Observation: Volume indicators do not provide a clear direction, signaling a lack of strong conviction from market participants.
Conclusion:
Based on the analysis of trend, momentum, volatility, and volume indicators, the stock is likely to experience further consolidation in the coming days. The lack of strong trend direction, coupled with mixed signals from momentum and volume indicators, suggests a period of indecision and potential sideways movement. Traders may consider adopting a cautious approach and wait for clearer signals before making significant trading decisions.
Recommendation:
- Short-term Traders: Consider staying on the sidelines until a clear trend emerges.
- Long-term Investors: Monitor the stock closely for any signs of a sustainable trend before making investment decisions.
Always remember to conduct thorough research and consider multiple factors before making any investment decisions.