Technical Analysis of YSEP 2024-05-10
Overview:
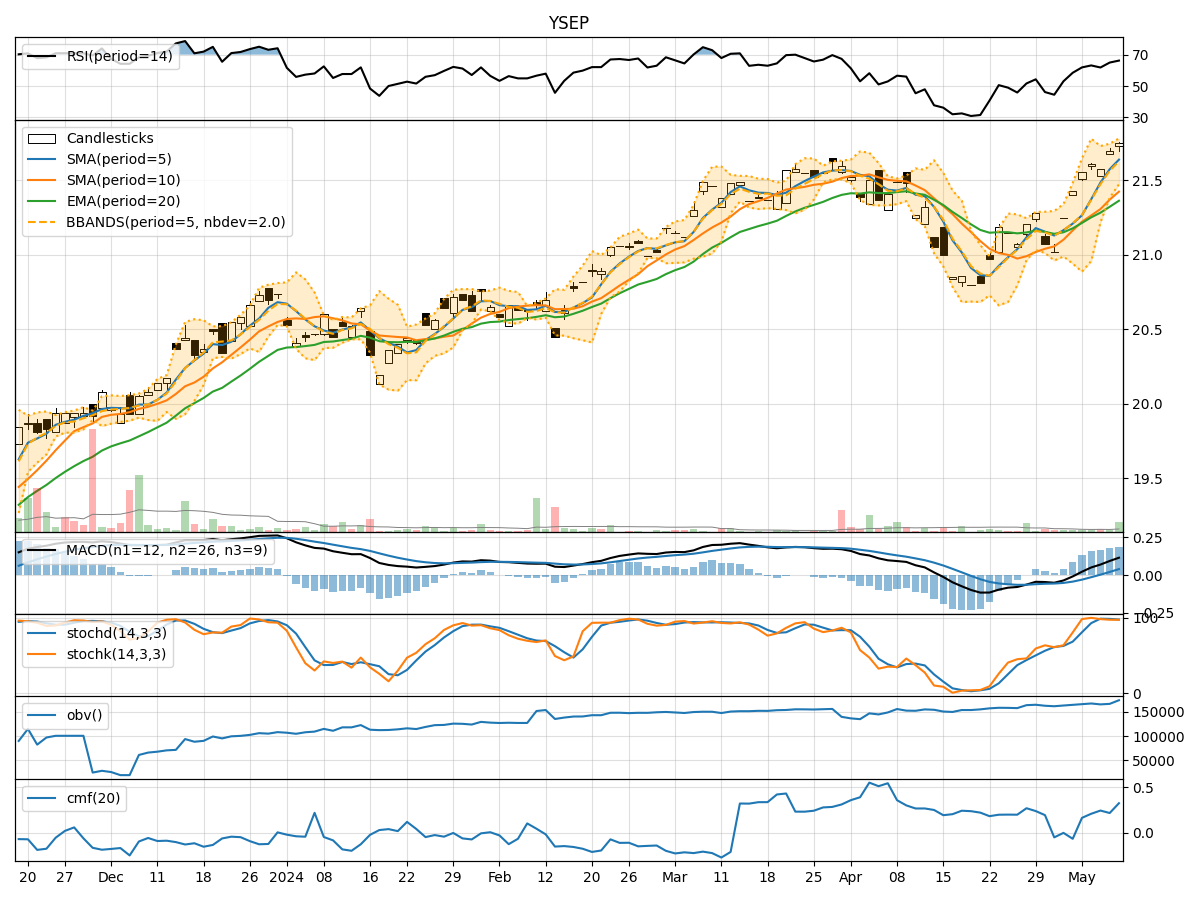
In the last 5 trading days, the stock has shown a consistent uptrend in terms of closing prices. The trend indicators such as Moving Averages (MA), MACD, and Momentum indicators like RSI and Stochastic Oscillator suggest a positive momentum in the stock. Volatility indicators like Bollinger Bands show a narrowing range, indicating a potential breakout. Volume indicators also show an increase in buying pressure. Based on these indicators, the stock is likely to continue its upward movement in the next few days.
Trend Analysis:
- Moving Averages (MA): The 5-day MA has been consistently above the closing prices, indicating a bullish trend.
- MACD: The MACD line has been above the signal line, showing a positive momentum.
- EMA: The Exponential Moving Average has been trending upwards, supporting the bullish sentiment.
Momentum Analysis:
- RSI: The Relative Strength Index has been in the overbought territory but has room for further upside, suggesting strong buying momentum.
- Stochastic Oscillator: Both %K and %D lines are in the overbought zone, indicating a strong bullish momentum.
Volatility Analysis:
- Bollinger Bands: The bands have been narrowing, indicating a potential breakout or continuation of the current trend.
- Bollinger %B: The %B indicator is above 0.8, suggesting a strong bullish momentum.
Volume Analysis:
- On-Balance Volume (OBV): The OBV has been steadily increasing, indicating strong buying pressure.
- Chaikin Money Flow (CMF): The CMF is positive, suggesting that money is flowing into the stock.
Key Observations:
- The stock is in a strong uptrend based on the trend indicators.
- Momentum indicators show a strong buying momentum with potential for further upside.
- Volatility indicators suggest a potential breakout or continuation of the current trend.
- Volume indicators confirm the bullish sentiment with increasing buying pressure.
Conclusion:
Based on the analysis of the technical indicators across trend, momentum, volatility, and volume, the stock is strongly bullish in the short term. The uptrend is likely to continue in the next few days, with the potential for further price appreciation. Traders and investors can consider taking long positions in the stock to capitalize on the upward momentum. It is important to monitor the indicators for any signs of reversal or consolidation, but the current outlook favors a continuation of the bullish trend.