Technical Analysis of YXI 2024-05-10
Overview:
In analyzing the technical indicators for YXI stock over the last 5 days, we will delve into the trend, momentum, volatility, and volume indicators to provide a comprehensive outlook on the possible stock price movement in the coming days. By examining these key factors, we aim to offer valuable insights and predictions to guide investment decisions.
Trend Analysis:
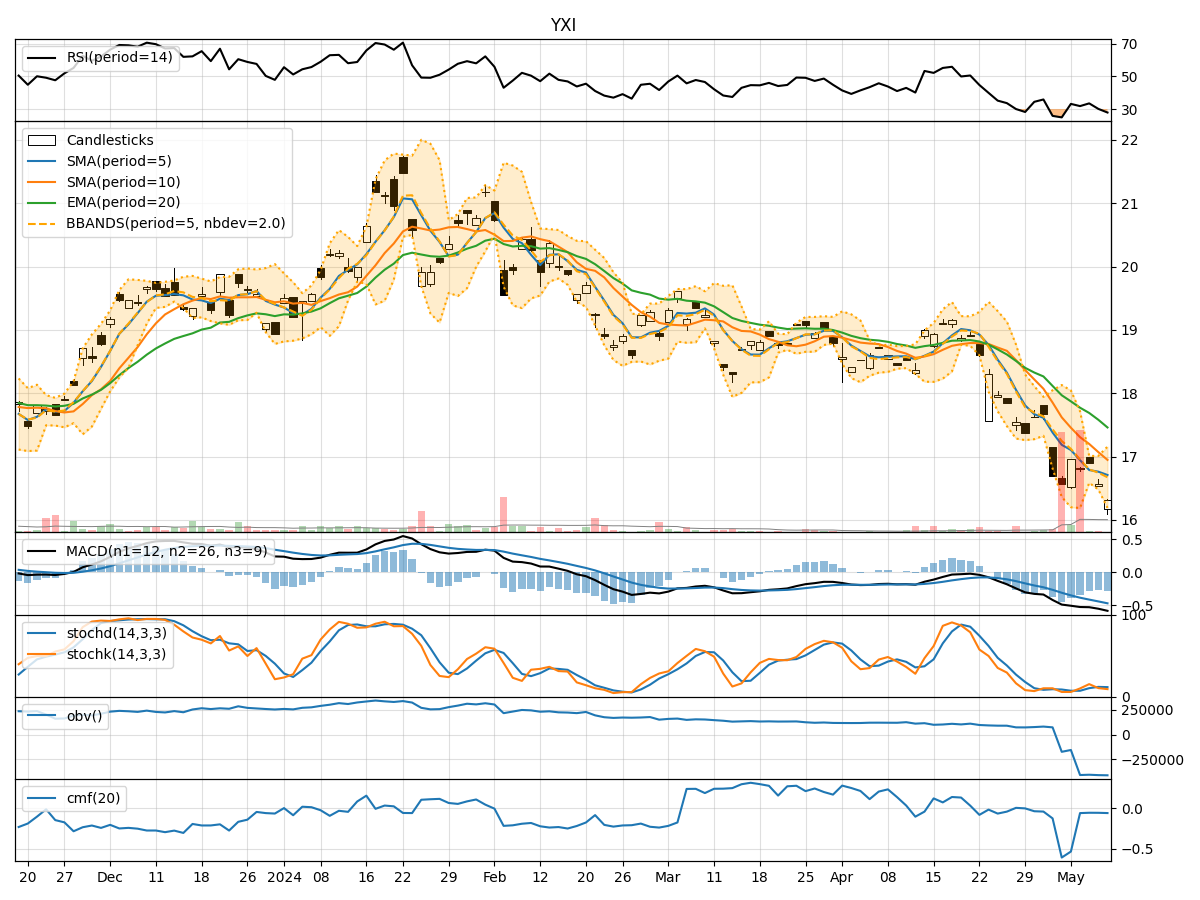
- Moving Averages (MA): The 5-day Moving Average (MA) has been consistently below the Simple Moving Average (SMA) and Exponential Moving Average (EMA), indicating a downward trend.
- MACD: The MACD line has been negative, with the MACD Histogram also showing a downward trend, suggesting bearish momentum in the stock price.
Momentum Analysis:
- RSI: The Relative Strength Index (RSI) has been below 50, indicating a bearish momentum in the stock.
- Stochastic Oscillator: Both %K and %D have been trending lower, reflecting a weakening momentum in the stock price.
Volatility Analysis:
- Bollinger Bands (BB): The stock price has been consistently trading below the middle Bollinger Band (BBM), indicating lower volatility and a potential consolidation phase.
- Bollinger Band Percentage (BBP): The BBP has been relatively low, suggesting a lack of significant price movement.
Volume Analysis:
- On-Balance Volume (OBV): The OBV has been declining, indicating selling pressure in the stock.
- Chaikin Money Flow (CMF): The CMF has been negative, signaling a bearish money flow in the stock.
Conclusion:
Based on the analysis of the technical indicators, the stock of YXI is currently in a bearish phase with downward trends in moving averages, MACD, RSI, and Stochastic Oscillator. The low volatility and negative volume indicators further support the bearish outlook. Therefore, the next few days are likely to see a continuation of the downward movement in the stock price. Investors should exercise caution and consider potential short-selling or wait for a more favorable entry point before considering long positions.