Technical Analysis of ZALT 2024-05-10
Overview:
In analyzing the technical indicators for ZALT stock over the last 5 days, we will delve into the trend, momentum, volatility, and volume indicators to provide a comprehensive outlook on the possible future stock price movement. By examining these key indicators, we aim to offer valuable insights and predictions for the upcoming trading days.
Trend Analysis:
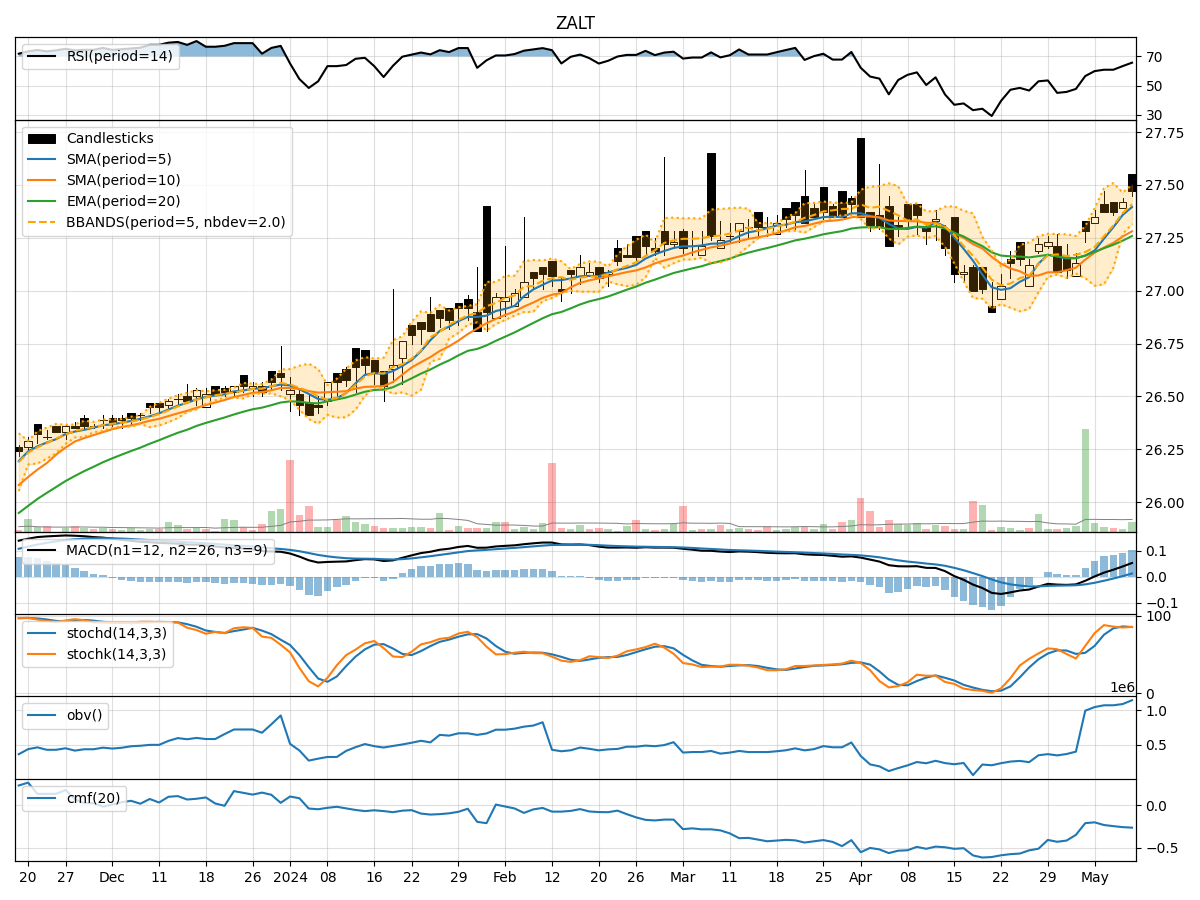
- Moving Averages (MA): The 5-day Moving Average (MA) has been consistently above the Simple Moving Average (SMA) and Exponential Moving Average (EMA), indicating a bullish trend.
- MACD: The MACD line has been consistently above the signal line, with both lines showing an upward trend, suggesting bullish momentum.
Momentum Analysis:
- RSI: The Relative Strength Index (RSI) has been gradually increasing and is currently in the overbought territory, indicating strong buying momentum.
- Stochastic Oscillator: Both %K and %D lines of the Stochastic Oscillator are in the overbought zone, suggesting a potential reversal or consolidation.
Volatility Analysis:
- Bollinger Bands (BB): The stock price has been trading within the Bollinger Bands, with the bands narrowing, indicating decreasing volatility.
Volume Analysis:
- On-Balance Volume (OBV): The OBV has been steadily increasing, reflecting accumulation by investors.
- Chaikin Money Flow (CMF): The CMF has been negative, indicating selling pressure in the stock.
Key Observations:
- The trend indicators suggest a strong bullish sentiment in the stock.
- Momentum indicators show overbought conditions, signaling a potential reversal or consolidation.
- Volatility has been decreasing, indicating a possible period of price stabilization.
- Volume indicators reflect mixed signals with OBV showing accumulation but CMF indicating selling pressure.
Conclusion:
Based on the analysis of the technical indicators, the next few days' possible stock price movement for ZALT is likely to be sideways or consolidating with a slight upward bias. The bullish trend and decreasing volatility may support a continuation of the current price levels, while the overbought momentum and mixed volume signals suggest a potential period of consolidation or a minor pullback. Traders should closely monitor key support and resistance levels for potential entry or exit points.
Disclaimer:
This analysis is based solely on technical indicators and historical data, and actual market movements may vary. It is essential to consider other factors and conduct thorough research before making any investment decisions. Consulting with a financial advisor is recommended for personalized investment advice tailored to individual risk tolerance and financial goals.