Technical Analysis of ZECP 2024-05-10
Overview:
In analyzing the technical indicators for ZECP over the last 5 days, we will delve into the trend, momentum, volatility, and volume indicators to provide a comprehensive outlook on the possible stock price movement in the coming days. By examining these key aspects, we aim to offer valuable insights and predictions to guide your investment decisions.
Trend Indicators:
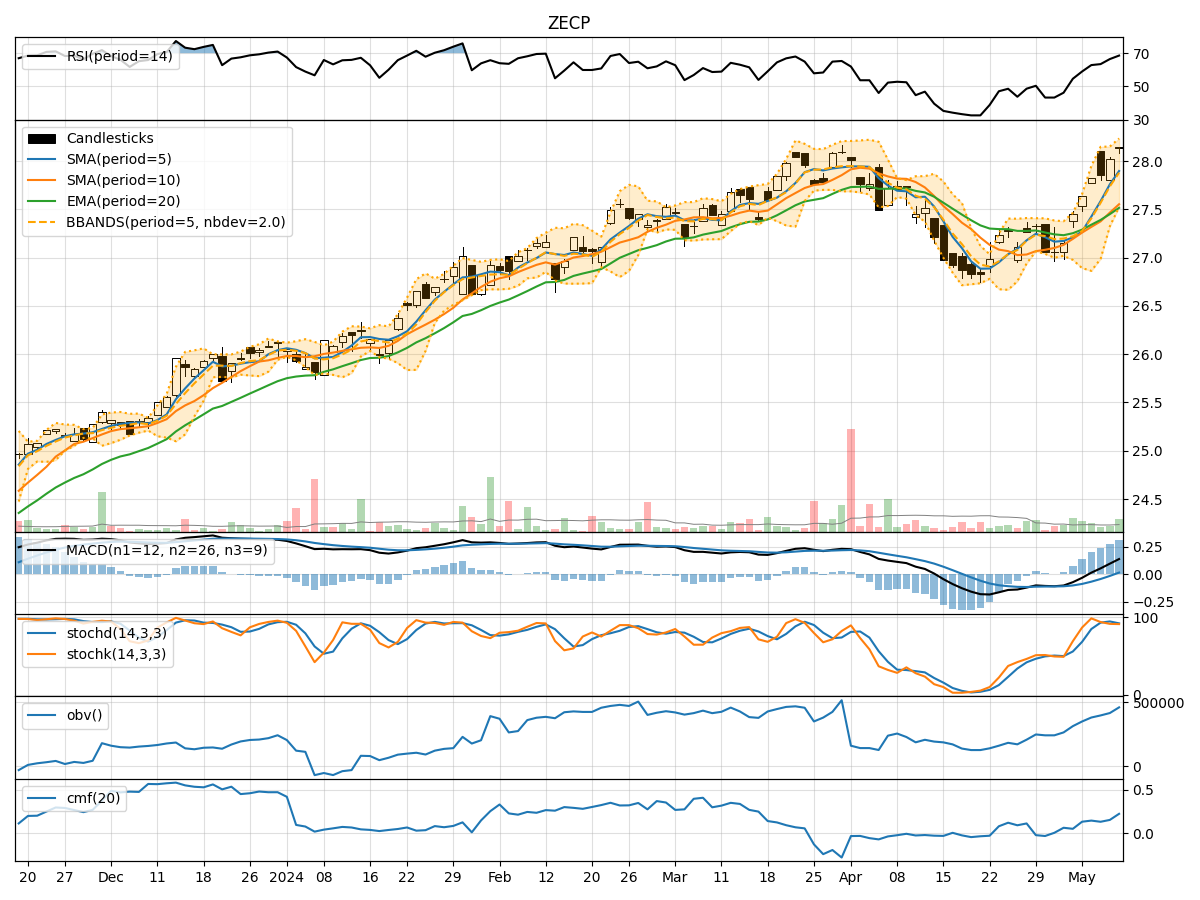
- Moving Averages (MA): The 5-day MA has been consistently above the closing prices, indicating a bullish trend.
- MACD: The MACD line has been steadily increasing, with the MACD histogram showing positive values, suggesting bullish momentum.
- RSI: The RSI has been trending upwards, indicating increasing buying pressure.
Momentum Indicators:
- Stochastic Oscillator: Both %K and %D have been relatively high, signaling strong bullish momentum.
- Williams %R: The indicator has been hovering around oversold levels, suggesting a potential reversal to the upside.
Volatility Indicators:
- Bollinger Bands: The stock price has been trading within the bands, indicating normal volatility.
- BB%: The %B indicator has been fluctuating within a normal range, reflecting typical price movement.
Volume Indicators:
- On-Balance Volume (OBV): The OBV has been steadily increasing, indicating accumulation by investors.
- Chaikin Money Flow (CMF): The CMF has been positive, suggesting buying pressure in the stock.
Key Observations:
- The trend indicators, momentum indicators, and volume indicators all point towards a bullish sentiment in the stock.
- Volatility indicators suggest that the stock is experiencing normal price fluctuations within a defined range.
Conclusion:
Based on the analysis of the technical indicators, it is highly likely that ZECP will experience further upward movement in the coming days. The bullish trend, positive momentum, increasing buying pressure, and accumulation by investors all support a positive outlook for the stock. Traders and investors may consider buying ZECP based on the current technical analysis.