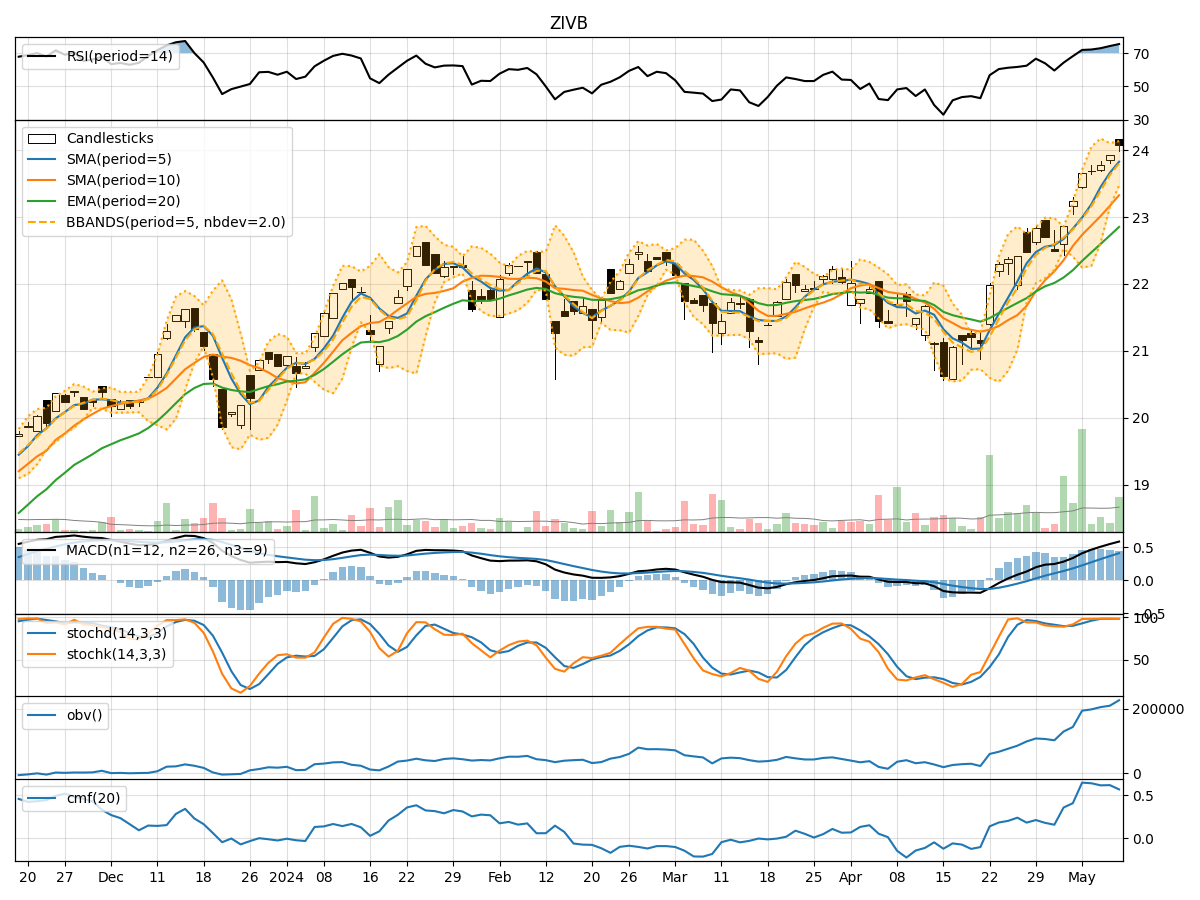
Technical Analysis of ZIVB 2024-05-10
Overview:
In analyzing the technical indicators for ZIVB over the last 5 days, we will delve into the trend, momentum, volatility, and volume indicators to provide a comprehensive outlook on the possible stock price movement in the coming days. By examining these key indicators, we aim to offer valuable insights and predictions for informed decision-making.
Trend Analysis:
- Moving Averages (MA): The 5-day MA has been consistently above the 10-day SMA, indicating a short-term bullish trend.
- Exponential Moving Average (EMA): The EMA has been steadily increasing, reflecting positive price momentum.
- Moving Average Convergence Divergence (MACD): The MACD and signal line have been trending upwards, suggesting bullish momentum.
Key Observation: The trend indicators point towards an upward trend in the stock price.
Momentum Analysis:
- Relative Strength Index (RSI): RSI values have been in the overbought territory, indicating strong buying pressure.
- Stochastic Oscillator (Stoch): Stochastics have been consistently high, signaling potential overbought conditions.
- Williams %R (WillR): WillR values have been fluctuating but generally in the oversold region.
Key Observation: Momentum indicators suggest that the stock is currently overbought and may face a potential correction.
Volatility Analysis:
- Bollinger Bands (BB): The stock price has been trading within the upper Bollinger Band, indicating increased volatility.
- Bollinger Band Width (BBW): The BBW has been widening, suggesting higher price fluctuations.
- Bollinger Band %B (BBP): BBP values have been above 0.8, indicating an overbought condition.
Key Observation: Volatility indicators imply that the stock is experiencing increased volatility and may see a pullback.
Volume Analysis:
- On-Balance Volume (OBV): OBV has been steadily increasing, reflecting strong buying volume.
- Chaikin Money Flow (CMF): CMF values have been positive, indicating money flow into the stock.
Key Observation: Volume indicators suggest that there is strong buying interest in the stock.
Conclusion:
Based on the analysis of trend, momentum, volatility, and volume indicators, the overall outlook for ZIVB in the next few days is as follows: - Trend: The stock is in an upward trend. - Momentum: Momentum indicators signal an overbought condition. - Volatility: Increased volatility may lead to a potential pullback. - Volume: Strong buying volume indicates positive investor sentiment.
Recommendation:
Considering the technical analysis and the current market dynamics, it is advisable to exercise caution due to the stock being overbought. Traders may consider taking profits or implementing risk management strategies. Long-term investors could wait for a potential pullback to enter at more favorable levels. Monitoring key support and resistance levels will be crucial in navigating the upcoming price movements.