Technical Analysis of ZROZ 2024-05-10
Overview:
In analyzing the technical indicators for ZROZ over the last 5 days, we will delve into the trend, momentum, volatility, and volume indicators to provide a comprehensive outlook on the possible stock price movement. By examining these key aspects, we aim to offer valuable insights and predictions for the upcoming days.
Trend Analysis:
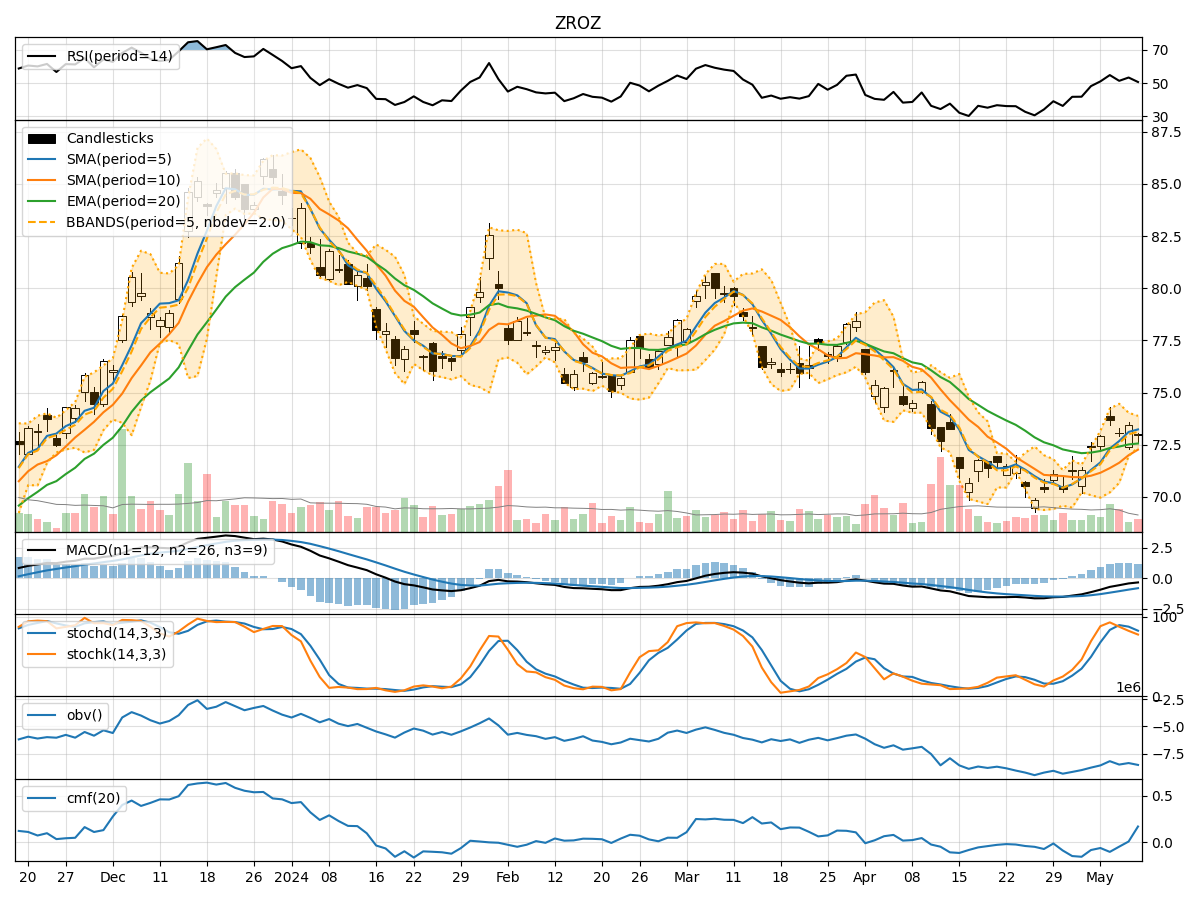
- Moving Averages (MA): The 5-day Moving Average (MA) has been consistently above the Simple Moving Average (SMA) and Exponential Moving Average (EMA), indicating a bullish trend.
- MACD: The MACD line has been below the signal line, suggesting a bearish trend. However, the MACD Histogram has shown signs of convergence, hinting at a potential trend reversal.
Momentum Analysis:
- RSI: The Relative Strength Index (RSI) has been fluctuating around the neutral 50 level, indicating indecision in the market.
- Stochastic Oscillator: Both %K and %D have been declining, signaling potential oversold conditions.
- Williams %R: The Williams %R has been in the oversold territory, suggesting a possible reversal in the near term.
Volatility Analysis:
- Bollinger Bands (BB): The stock price has been trading within the Bollinger Bands, with the bands narrowing, indicating reduced volatility.
- Bollinger %B: The %B indicator has been hovering around the middle range, reflecting a balanced market sentiment.
Volume Analysis:
- On-Balance Volume (OBV): The OBV has shown a mixed trend, indicating uncertainty in the accumulation/distribution of the stock.
- Chaikin Money Flow (CMF): The CMF has been negative, suggesting outflows from the stock.
Key Observations:
- The trend indicators suggest a bullish bias, supported by the moving averages.
- Momentum indicators point towards a potential reversal, with oversold conditions indicated by the stochastic oscillator and Williams %R.
- Volatility has been decreasing, indicating a possible period of consolidation.
- Volume indicators reflect mixed signals, with no clear accumulation or distribution pattern.
Conclusion:
Based on the analysis of the technical indicators, the next few days for ZROZ could see sideways movement with a slight upward bias. The bullish trend indicated by the moving averages may be challenged by the bearish momentum signals, but the decreasing volatility suggests a period of consolidation. Traders should monitor key support and resistance levels closely to gauge the stock's price action.