Technical Analysis of ZSB 2024-05-10
Overview:
In analyzing the technical indicators for ZSB stock over the last 5 days, we will delve into the trend, momentum, volatility, and volume indicators to provide a comprehensive outlook on the possible stock price movement in the coming days.
Trend Analysis:
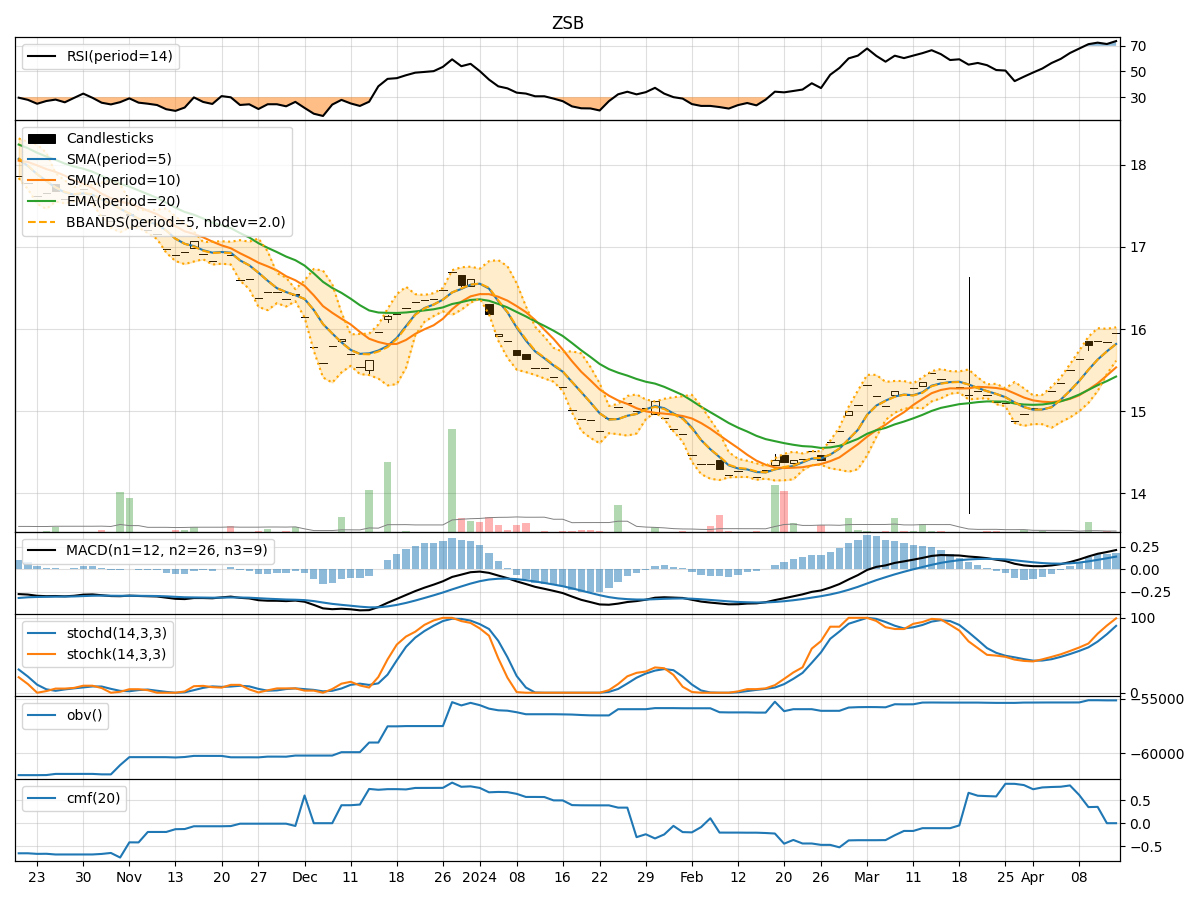
- Moving Averages (MA): The 5-day Moving Average (MA) has been consistently above the Simple Moving Average (SMA) and Exponential Moving Average (EMA), indicating a bullish trend.
- MACD: The MACD line has been above the signal line, with the MACD Histogram showing a decreasing trend but still in positive territory, suggesting a potential slowdown in bullish momentum.
Momentum Analysis:
- RSI: The Relative Strength Index (RSI) has been fluctuating around the 60 level, indicating a neutral momentum.
- Stochastic Oscillator: Both %K and %D have been moving in the overbought zone, suggesting a potential reversal or consolidation.
- Williams %R: The Williams %R is hovering around the oversold territory, indicating a potential buying opportunity.
Volatility Analysis:
- Bollinger Bands (BB): The stock price has been trading within the Bollinger Bands, with the bands narrowing, indicating decreasing volatility.
Volume Analysis:
- On-Balance Volume (OBV): The OBV has been showing a slight decrease, suggesting some distribution happening in the stock.
- Chaikin Money Flow (CMF): The CMF has been negative, indicating selling pressure in the stock.
Key Observations and Opinions:
- Trend: The stock is currently in an upward trend based on moving averages, but the MACD Histogram suggests a potential slowdown in momentum.
- Momentum: The RSI and Stochastic Oscillator indicate a neutral to slightly bearish momentum, while the Williams %R shows a potential buying opportunity.
- Volatility: The narrowing Bollinger Bands suggest decreasing volatility in the stock.
- Volume: The OBV and CMF indicate some distribution and selling pressure in the stock.
Conclusion:
Based on the analysis of the technical indicators, the next few days' possible stock price movement for ZSB is likely to experience consolidation or a slight pullback. The stock may trade within a range as the momentum indicators are mixed, and there is selling pressure indicated by volume indicators. Traders should exercise caution and wait for clearer signals before making significant trading decisions.