Technical Analysis of ZTEN 2024-05-10
Overview:
In analyzing the technical indicators for ZTEN stock over the last 5 days, we will delve into the trend, momentum, volatility, and volume indicators to provide a comprehensive outlook on the possible stock price movement in the coming days. By examining these key indicators, we aim to offer valuable insights and predictions for potential investors and traders.
Trend Indicators:
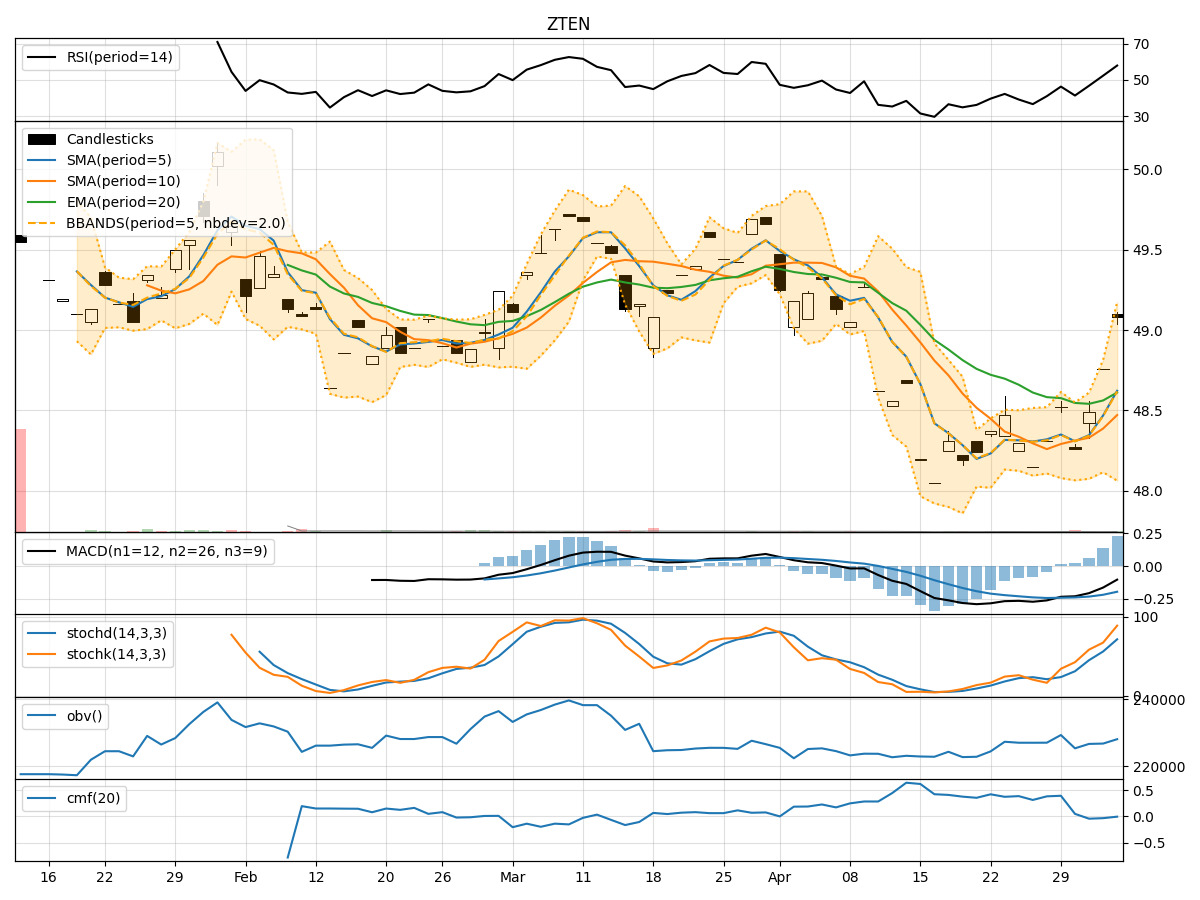
- Moving Averages (MA): The 5-day Moving Average (MA) has been consistently above the Simple Moving Average (SMA) and Exponential Moving Average (EMA), indicating a bullish trend.
- MACD: The MACD line has been consistently above the signal line, with both lines showing an upward trend, suggesting bullish momentum.
- MACD Histogram: The MACD Histogram has been increasing over the past 5 days, indicating strengthening bullish momentum.
Momentum Indicators:
- RSI: The Relative Strength Index (RSI) has been fluctuating around the 50 level, indicating a neutral momentum in the stock.
- Stochastic Oscillator: Both %K and %D lines of the Stochastic Oscillator have been gradually decreasing, suggesting a potential shift towards oversold conditions.
- Williams %R: The Williams %R indicator has been moving towards oversold territory, indicating a possible buying opportunity.
Volatility Indicators:
- Bollinger Bands: The Bollinger Bands have been narrowing, indicating decreasing volatility in the stock price.
- Bollinger %B: The %B indicator has been hovering around the middle range, suggesting a period of consolidation.
- Average True Range (ATR): The ATR has been relatively stable, indicating consistent price movement without significant spikes.
Volume Indicators:
- On-Balance Volume (OBV): The OBV has shown mixed signals with fluctuations in volume, indicating indecision among market participants.
- Chaikin Money Flow (CMF): The CMF has been negative, suggesting that money may be flowing out of the stock.
Key Observations and Opinions:
- Trend: The trend indicators suggest a bullish sentiment in the stock, supported by the moving averages and MACD analysis.
- Momentum: The momentum indicators show a neutral to slightly bearish outlook, with potential oversold conditions indicated by the Stochastic and Williams %R.
- Volatility: Volatility has been decreasing, indicating a period of consolidation and potential price stability.
- Volume: The volume indicators reflect mixed signals, with no clear direction in terms of investor participation.
Conclusion:
Based on the analysis of the technical indicators, the stock is likely to experience sideways consolidation in the coming days. While the trend remains bullish, the momentum indicators suggest a possible short-term pullback or consolidation phase. Investors should closely monitor key support and resistance levels for potential entry or exit points. It is advisable to exercise caution and wait for clearer signals before making significant trading decisions.