In the fast-paced trading arena, having the right tools at your disposal can mean the difference between catching profitable opportunities and being left behind. One of the most popular and reliable indicators traders use is the Moving Average Convergence Divergence, or MACD. Particularly valuable are MACD bullish and bearish divergences, which help traders spot potential shifts in market trends and momentum. Whether your portfolio includes stocks, cryptocurrencies, or ETFs, knowing how to identify and interpret these divergences can significantly enhance your trading decisions.
Mastering MACD divergences can empower you to better anticipate market moves, avoid common pitfalls, and enhance your returns. And here's the good news: tools like Kavout Smart Signals make it easy to get real-time MACD divergence signals, helping you quickly identify actionable trading opportunities across stocks, ETFs, and cryptocurrencies. With instant market scanning and user-friendly filtering, Kavout simplifies the process of leveraging MACD divergence, allowing you to focus on making smarter investment choices.

The MACD Indicator Explained
To effectively leverage MACD divergence, you first need a solid grasp of the MACD indicator itself. MACD consists of three main components:
- MACD Line: Derived by subtracting the 26-period EMA from the 12-period EMA, it reflects the asset's short-term momentum.
- Signal Line: A 9-period EMA of the MACD line, offering confirmation of trends.
- Histogram: Visualizes the distance between the MACD and signal lines, indicating strengthening or weakening momentum.
Though MACD is a lagging indicator based on historical data, it excels at signaling momentum shifts that can precede price reversals.
Bullish Divergence: Identifying Trend Reversals Upward
What is Bullish MACD Divergence?
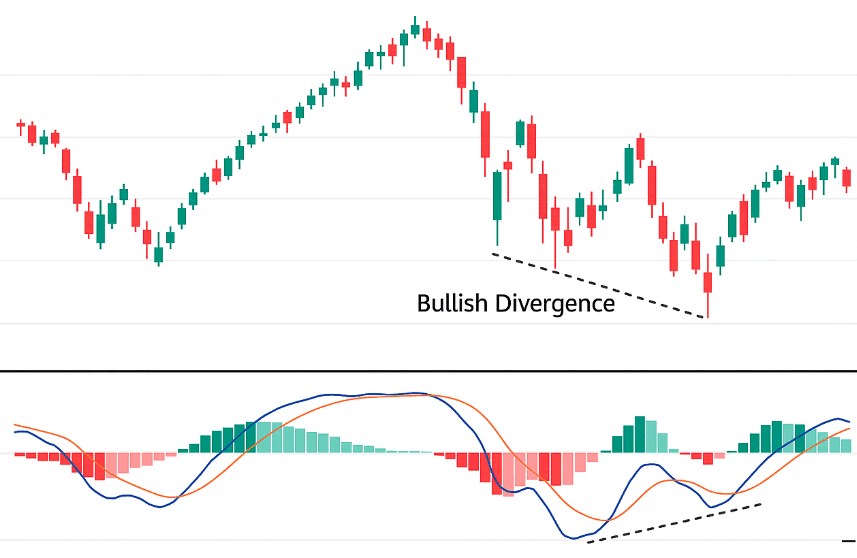
Bullish divergence occurs when an asset’s price is forming lower lows, yet the MACD line is simultaneously forming higher lows. This signals that selling momentum is weakening, potentially forecasting an upcoming bullish reversal.
Spotting Bullish Divergence
- Price Pattern: Series of lower lows.
- MACD Pattern: Series of higher lows.
Trading Bullish Divergence
- Stocks: Confirm bullish divergence with support levels or additional indicators like RSI to strengthen buy signals.
- Cryptos: Highly effective in the volatile crypto markets for pinpointing entry points at potential bottoms.
- ETFs: Useful for recognizing shifts in sector or market-wide sentiment, allowing traders to position themselves early.
Example
Suppose a tech stock price hits consecutive new lows while MACD forms higher lows. This divergence suggests the downtrend is weakening. A trader noticing this divergence could enter a long position, anticipating an upward reversal.
Bearish Divergence: Preparing for Downside Reversals
What is Bearish MACD Divergence?
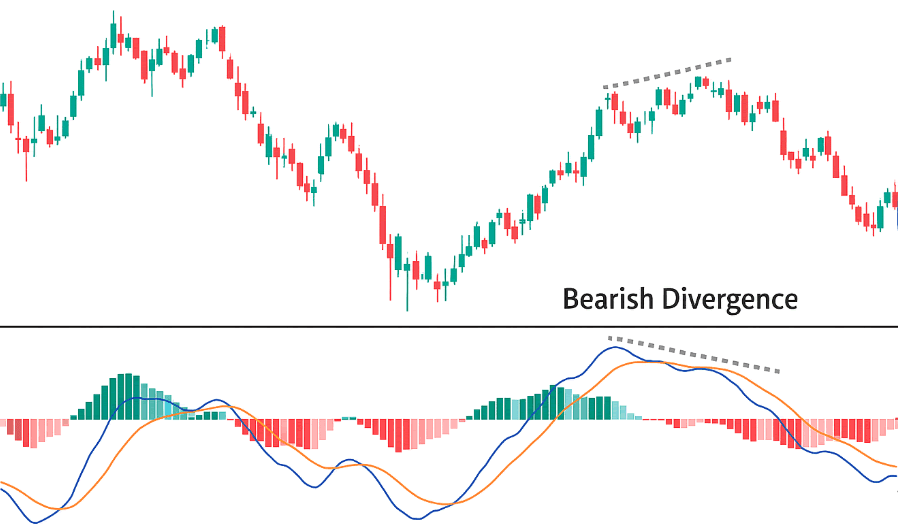
Bearish divergence happens when prices make higher highs but the MACD line shows lower highs, suggesting that bullish momentum is diminishing and a price correction might be imminent.
Spotting Bearish Divergence
- Price Pattern: Series of higher highs.
- MACD Pattern: Series of lower highs.
Trading Bearish Divergence
- Stocks: Useful for identifying potential corrections or market pullbacks.
- Cryptos: Vital for avoiding buying into weakening rallies.
- ETFs: Indicates possible broader market or sector pullbacks, advising traders to exercise caution or hedge positions.
Example
Imagine a cryptocurrency reaching new highs while MACD is forming lower highs. This divergence warns that the bullish run might soon lose steam. Traders seeing this divergence could either exit long positions or initiate shorts, protecting their investments and potentially profiting from the downturn.
Enhancing MACD Divergence Signals
While MACD divergence alone can be powerful, enhancing signals with additional technical indicators increases reliability:
- Relative Strength Index (RSI): Confirms divergences by signaling overbought or oversold conditions.
- Support and Resistance Levels: Divergences near these critical levels offer stronger reversal indications.
- Candlestick Patterns: Patterns such as engulfing or doji provide further confirmation of potential reversals.
Best Practices for Trading with MACD Divergence
To maximize the effectiveness of MACD divergences, adopt these proven strategies:
- Combine Indicators: Use RSI, Bollinger Bands, or moving averages to confirm MACD signals.
- Validate with Price Action: Incorporate trend lines and candlestick patterns for additional confirmation.
- Contextual Analysis: Consider the broader market environment before acting on divergence signals.
- Backtest: Evaluate MACD divergence effectiveness through historical testing.
- Risk Management: Apply stop-losses and disciplined position sizing to mitigate false signals.
- Multiple Timeframes: Utilize MACD across short and longer-term charts to optimize trading strategies from day trading to swing trading.
Final Thoughts
Mastering MACD divergence can transform your trading approach by enabling more accurate anticipation of market reversals. Integrating MACD divergence with complementary indicators and robust risk management significantly improves your chances of consistent trading success.
Take Your Trading to the Next Level with Kavout Smart Signals
At Kavout, we've simplified MACD divergence trading for you:
- Instant market scanning using 30-minute and 1-hour real-time data
- Easily filter stocks, ETFs, or cryptos with a single click
- Quickly identify day trading and swing trading opportunities using MACD divergence signals
Explore Kavout Smart Signals now and leverage MACD divergence for smarter trading decisions today!