


Forex News•17 hours ago
Intraday Analysis 30.07.2026
USDJPY fell after hitting a double-top rejection, with bearish divergence signaling slowing upward momentum.
Navigating the fast-paced worlds of Forex and Cryptocurrency trading requires sharp tools and a keen understanding of market dynamics. Among the most powerful concepts in a technical trader's arsenal is "divergence," a subtle yet potent signal that can hint at upcoming price shifts. This guide will walk you through using two popular indicators, the Relative Strength Index (RSI) and the Moving Average Convergence Divergence (MACD), to spot and trade these divergences. For traders looking to streamline this process, tools like Kavout's Smart Signals (https://www.kavout.com/smart-signals) can help by automatically scanning markets for these types of trading signals in Cryptos and Forex Pairs.
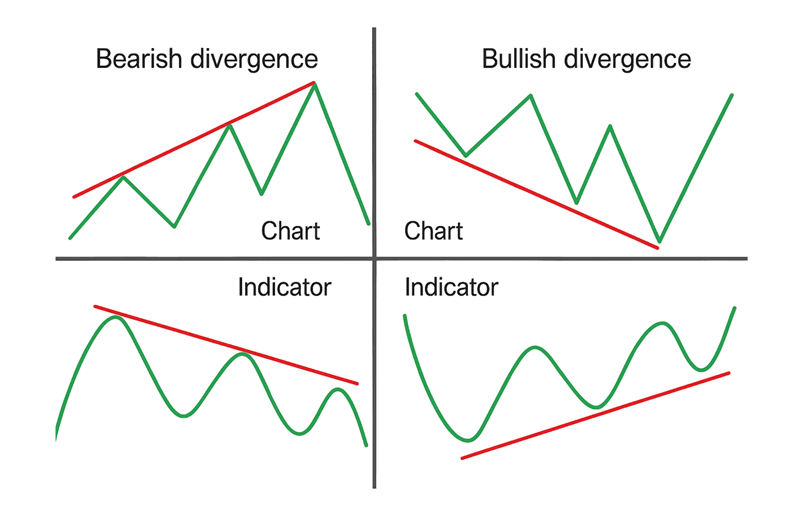
Technical analysis is all about using historical data to anticipate future price movements. Momentum oscillators like the RSI and MACD are staples because momentum often changes before price does. Divergence occurs when the price of an asset is moving in one direction, but a technical indicator is moving in the opposite direction. This mismatch can be an early warning that the current trend is losing steam or that a reversal is on the horizon.
Imagine a stock hitting a new high, but your momentum indicator fails to do the same. This "bearish divergence" suggests that the buying power behind the new high isn't as strong as it was for previous highs, and the price might soon turn downwards.
The RSI is excellent for gauging the speed of price changes and identifying overbought or oversold conditions. The MACD, on the other hand, uses moving averages to track trend strength and direction. Because they measure momentum differently, seeing divergence on both indicators around the same time can be a particularly strong signal.
The Relative Strength Index (RSI) is a momentum oscillator that measures the speed and magnitude of recent price changes, displayed as a value between 0 and 100. It helps traders assess whether an asset is overbought or oversold.
Here's a quick guide to interpreting RSI values:
Table 1: RSI Value Interpretation
| RSI Reading | Market Condition Interpretation | Potential Signal Indication (Context Dependent) |
|---|---|---|
| Above 70 (or 80) | Overbought | Potential Sell/Short (especially if bearish divergence or in ranging market) |
| Below 30 (or 20) | Oversold | Potential Buy/Long (especially if bullish divergence or in ranging market) |
| Around 50 | Neutral / Equilibrium | Crossing above 50: increasing bullish momentum; Crossing below 50: increasing bearish momentum |
| 40-50 in Uptrend | Support Zone | Potential Buy on pullback |
| 50-60 in Downtrend | Resistance Zone | Potential Sell on rally |
Export to Sheets
It's important to note that in strong trends, the RSI can stay in overbought or oversold territory for extended periods. Therefore, these levels are not standalone buy or sell signals but are more reliable when combined with other factors, like divergence.
RSI divergence happens when the direction of the RSI's peaks and troughs doesn't match the price's peaks and troughs. This signals that the momentum behind the current price trend might be changing.
There are two main types of RSI divergence:
Here's a cheat sheet for RSI divergences:
Table 2: RSI Divergence Cheat Sheet
| Divergence Type | Price Action | RSI Action | Implication | Market Condition Favoring Signal |
|---|---|---|---|---|
| Regular Bullish | Lower Lows | Higher Lows | Potential Upward Reversal | Oversold (e.g., <30) |
| Regular Bearish | Higher Highs | Lower Highs | Potential Downward Reversal | Overbought (e.g., >70) |
| Hidden Bullish | Higher Lows | Lower Lows | Potential Uptrend Continuation | During an existing uptrend |
| Hidden Bearish | Lower Highs | Higher Highs | Potential Downtrend Continuation | During an existing downtrend |
Export to Sheets
The Moving Average Convergence Divergence (MACD) is a versatile trend-following momentum indicator. It shows the relationship between two exponential moving averages (EMAs) of an asset's price, helping to identify changes in trend strength, direction, and momentum.
The MACD has three main components:
Here’s how to interpret MACD signals:
Table 3: MACD Component Signals
| MACD Component | Signal Type | Interpretation | Strength Factor |
|---|---|---|---|
| MACD Line/Signal Line | Bullish Crossover | MACD crosses ABOVE Signal Line; potential buy signal, increasing bullish momentum | Further below zero line = stronger |
| MACD Line/Signal Line | Bearish Crossover | MACD crosses BELOW Signal Line; potential sell signal, increasing bearish momentum | Further above zero line = stronger |
| MACD Line/Zero Line | Bullish Crossover | MACD crosses ABOVE Zero Line; shift to overall bullish momentum | Longer histogram bars = stronger |
| MACD Line/Zero Line | Bearish Crossover | MACD crosses BELOW Zero Line; shift to overall bearish momentum | Longer histogram bars = stronger |
| MACD Histogram | Positive & Growing | Increasing bullish momentum | Height of bars |
| MACD Histogram | Positive & Shrinking | Decreasing bullish momentum (potential exhaustion) | Height of bars shrinking towards zero |
| MACD Histogram | Negative & Growing | Increasing bearish momentum | Height of bars (more negative) |
| MACD Histogram | Negative & Shrinking | Decreasing bearish momentum (potential exhaustion) | Height of bars shrinking towards zero |
Export to Sheets
MACD divergence occurs when the MACD indicator (either the line or the histogram) moves in the opposite direction to the asset's price. This discrepancy signals that the momentum measured by the MACD isn't confirming the current price trend, often foreshadowing a potential weakening of the trend.
Like RSI, MACD has regular and hidden divergences:
Here's a cheat sheet for MACD divergences:
Table 4: MACD Divergence Cheat Sheet
| Divergence Type | Price Action | MACD Line Action | MACD Histogram Action | Implication |
|---|---|---|---|---|
| Regular Bullish | Lower Lows | Higher Lows | Higher Lows (Troughs) | Potential Upward Reversal |
| Regular Bearish | Higher Highs | Lower Highs | Lower Highs (Peaks) | Potential Downward Reversal |
| Hidden Bullish | Higher Lows | Lower Lows | Lower Lows (Troughs) | Potential Uptrend Continuation |
| Hidden Bearish | Lower Highs | Higher Highs | Higher Highs (Peaks) | Potential Downtrend Continuation |
Export to Sheets
The Forex market has its own rhythm. When trading divergences here, it's wise to focus on major, highly liquid currency pairs like EUR/USD, GBP/USD, or USD/JPY, as they tend to provide more reliable signals. Always keep an eye on the economic calendar; major news releases can swiftly override even the clearest technical signals. Given the 24/5 nature of Forex, opportunities can pop up anytime, but signals on major pairs might be clearer during active London and New York trading sessions.
RSI Divergence Strategy in Forex:
MACD Divergence Strategy in Forex:
Timeframe Matters: Divergences on higher timeframes (like H4 or Daily) are generally more significant and reliable, often signaling major trend shifts. These suit swing or position traders. Lower timeframes (M15, H1) generate more frequent signals but can be "noisier," typically used by intraday traders. A robust approach is multi-timeframe analysis: identify the dominant trend on a higher timeframe, then look for divergence-based entries on a lower timeframe that align with that broader context.
Cryptocurrency markets are famous for their high volatility. This means rapid and substantial price swings, which require careful adjustments to your divergence trading strategies and indicator settings. The "fear and greed" cycles common in crypto can lead to more pronounced divergences.
Adjusting Indicators for Crypto Volatility:
Due to crypto's volatility, standard indicator settings might need tweaking:
Table 5: RSI/MACD Settings Adjustments for Crypto Volatility
| Indicator | Parameter | Standard Setting | Crypto Adjustment Rationale | Suggested Crypto Range (Examples) |
|---|---|---|---|---|
| RSI | Period | 14 | Faster signals for volatility vs. smoother to reduce noise | 7-9 (faster), 21 (smoother) |
| RSI | Overbought Level | 70 | Widen to avoid premature signals in strong volatile up-moves | 75 or 80 |
| RSI | Oversold Level | 30 | Widen to avoid premature signals in strong volatile down-moves | 25 or 20 |
| MACD | Fast EMA | 12 | Adjust for sensitivity to rapid price changes | e.g., 5, 8 |
| MACD | Slow EMA | 26 | Adjust for sensitivity/smoothing | e.g., 13, 17, 35 |
| MACD | Signal Line | 9 | Adjust in line with Fast/Slow EMA changes | e.g., 5, 9 |
Export to Sheets
RSI Divergence Strategy in Crypto: The core principles for entry, stop-loss, and take-profit are similar to Forex. However, due to higher volatility, stop-losses might need to be proportionally wider to avoid being prematurely triggered by market noise. Profit targets can also be more ambitious. Strong confirmation of divergence signals is especially crucial. In crypto, RSI divergences can often be more reliable than simple overbought/oversold readings, as assets can stay "overbought" or "oversold" for long periods during strong trends.
MACD Divergence Strategy in Crypto: Again, the fundamental approach mirrors Forex, but with heightened attention to confirmation. Bullish MACD divergence can be very useful for identifying potential entry points near market bottoms after sharp declines. Bearish MACD divergence is vital for spotting weakening rallies and avoiding buying into unsustainable "pumps."
Higher Timeframes are Key in Crypto: Divergences on higher timeframes (Daily, Weekly) generally carry more weight and are less susceptible to the short-term noise common in crypto. These can provide more reliable indications of major trend shifts. Shorter-term divergences can then be used to fine-tune entries if they align with the higher-timeframe picture.
Why use one when you can use two? Combining signals from both RSI and MACD for divergence analysis can lead to more robust and reliable trading decisions. When both indicators independently show divergence around the same price swing, it suggests the momentum shift is confirmed by two distinct analytical perspectives, increasing confidence in the signal.
Here are a few scenarios:
A systematic approach:
Divergence signals are powerful, but they're not crystal balls. They can give false positives, especially in strongly trending or choppy markets. That's why seeking confirmation from other technical analysis tools or price action itself is crucial. This helps filter out weaker setups.
Think of confirmation as adding layers of evidence. Key methods include:
Waiting for confirmation means you might not catch the absolute bottom or top, but it significantly reduces the risk of acting on a false signal.
No trading strategy is foolproof, and divergence signals will sometimes fail. This is where robust risk management becomes your lifeline, ensuring you can withstand losing trades and stay in the game long enough for your strategy's edge to play out.
Table 6: Risk Management Checklist for Divergence Trading
| Risk Management Aspect | Action/Consideration | Why It's Critical |
|---|---|---|
| Trade Entry | Wait for confirmation (price action, volume, S/R, other indicators)? | Reduces false signals from raw divergence. |
| Stop-Loss Order | Is a stop-loss placed based on technical levels (e.g., beyond swing point, ATR)? | Defines max loss if divergence fails; invalidates trade idea if hit. |
| Position Sizing | Is position size calculated based on stop-loss distance and max % risk per trade? | Ensures no single trade can cripple the account. |
| Risk-Reward Ratio | Is the potential reward at least 1.5x or 2x the potential risk? | Ensures winning trades outweigh losers over time. |
| Market Context | Is the divergence aligned with or against the dominant higher-timeframe trend? | Divergence against strong trends is riskier. Hidden divergence aligns with trend. |
| Asset Volatility | Are indicator settings & stop-loss placement adjusted for the asset's volatility? | Prevents being stopped out by normal noise, especially in crypto. |
| Economic Calendar | Are any high-impact news events imminent that could override technicals? | News can invalidate technical setups. |
| Emotional Discipline | Am I sticking to the plan, or am I tempted to move stops/add to a losing trade? | Prevents emotional decisions that increase risk. |
Export to Sheets
Key risk management practices include:
RSI and MACD divergences are powerful tools for spotting potential shifts in market momentum. Mastering them involves understanding each indicator, recognizing the different types of divergence, and, crucially, confirming these signals with other forms of analysis like price action, volume, and key market levels.
Remember, divergence trading shouldn't be a standalone system. It's most effective when integrated into a broader trading plan that considers overall market structure and multiple timeframes. The real art lies in understanding the market psychology these patterns reflect—the fading conviction of one group and the emerging strength of another.
Success with these strategies demands practice, patience, and a commitment to continuous learning. Backtest on historical data, practice on a demo account, and patiently wait for high-quality, confirmed setups. Financial markets are always evolving, so stay adaptable. For traders looking to leverage technology, platforms like Kavout's Smart Signals (https://www.kavout.com/smart-signals) can assist by providing automated scans for divergence signals across cryptocurrencies and Forex pairs, helping to identify potential opportunities more efficiently.
By diligently applying these principles, you can harness the predictive power of divergence to make more informed and potentially more profitable decisions in the exciting arenas of Forex and Cryptocurrency trading. Happy trading!