MarketLens

Log in

RSI Divergence Explained: Bullish and Bearish Signals—and How It Differs from MACD Divergence

1 year ago
SHARE THIS ON:

Markets move fast. Momentum shifts happen in the blink of an eye, and if you're not paying attention, opportunity slips away just as quickly. That's why technical traders rely on tools that help them spot these changes early.

One of the most underappreciated tools? RSI divergence.

While MACD divergence has long been a go-to signal for trend reversals, RSI divergence offers its own unique advantage: speed. It’s often quicker to react, making it a favorite for traders looking to catch reversals just as they form.

In this guide, we’ll break down what RSI divergence is, how to read bullish and bearish signals, and how it compares to the popular MACD divergence.

What is RSI Divergence?

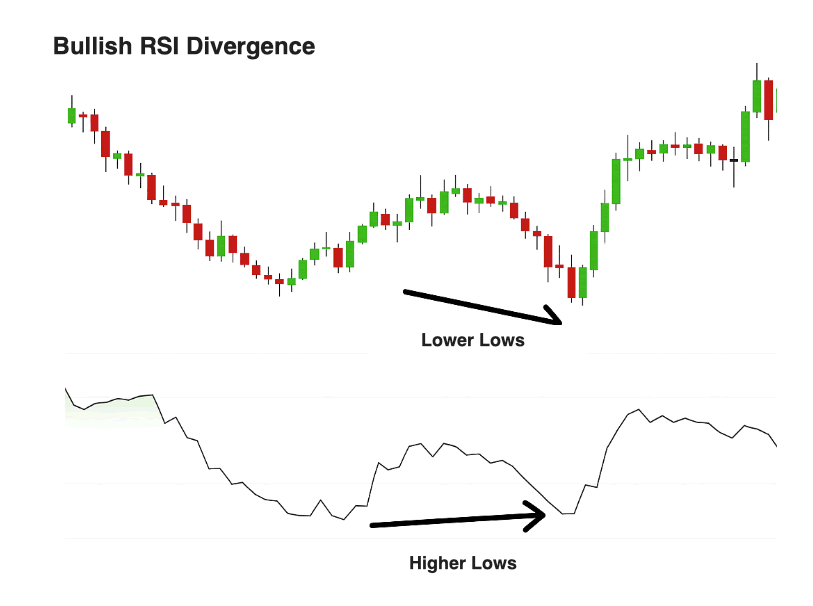
RSI divergence occurs when the price of an asset and the RSI indicator move in opposite directions. This mismatch can signal a potential shift in market momentum, often foreshadowing a trend reversal. The RSI is a momentum oscillator ranging from 0 to 100, where values above 70 typically indicate overbought conditions, and below 30 suggest oversold conditions. 2025051701.png

Types of RSI Divergence

  • Bullish RSI Divergence: Occurs when prices form lower lows, but RSI makes higher lows. This indicates decreasing selling pressure and signals potential upward reversals, providing traders an entry point for long positions.

2025051702.png

  • Bearish RSI Divergence: Occurs when prices form higher highs, but RSI makes lower highs. This signals weakening buying momentum and potential downward reversals, alerting traders to possible short positions. 2025051703.png

What Does RSI Divergence Tell Traders?

RSI divergence is a potent indicator that provides traders early warnings of possible trend reversals. It highlights discrepancies between price movements and RSI momentum, enabling traders to anticipate market shifts before they fully manifest. This capability is especially useful in volatile or range-bound markets where early decision-making can provide significant advantages.

However, RSI divergence isn't flawless and should be combined with other indicators and analyses to validate signals and minimize false alerts. Using it alongside candlestick patterns, volume analysis, or trendline breakouts significantly improves trading decision accuracy.

Bullish vs Bearish RSI Divergence Signals

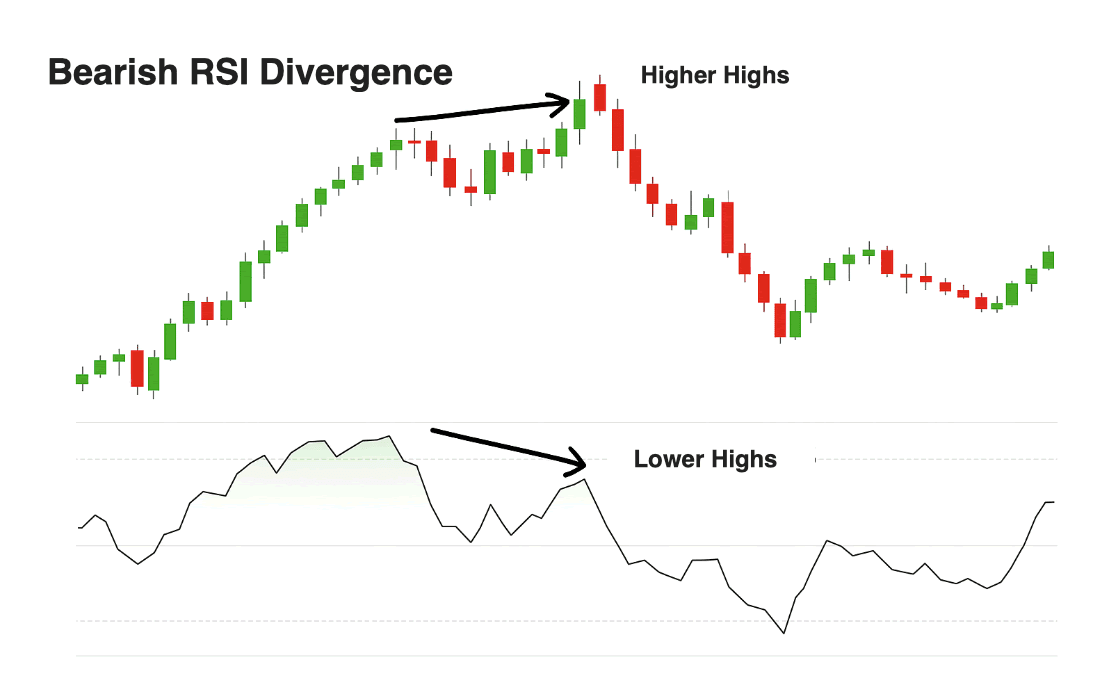
Knowing the distinction between bullish and bearish RSI divergence enhances your trading effectiveness:

Bullish RSI Divergence

  • Market Condition: Commonly in oversold scenarios (RSI below 30).
  • Confirmation Signals: Support level breakouts, rising volume, bullish candlestick patterns (e.g., pin bars, bullish engulfing).
  • Risk Management: Generally lower risk if combined with supporting bullish signals.

Bearish RSI Divergence

  • Market Condition: Typically appears in overbought markets (RSI above 70).
  • Confirmation Signals: Resistance level breakdowns, declining volume, bearish candlestick patterns (e.g., evening stars, shooting stars).
  • Risk Management: Higher caution needed; validate with resistance tests and confirmed pullbacks.

RSI Divergence vs MACD Divergence

Both RSI and MACD (Moving Average Convergence Divergence) divergences are valuable tools, yet each has unique characteristics and applications:

FactorRSI DivergenceMACD Divergence
Primary UseIdentifying overbought/oversold reversalsDetecting trend-following momentum shifts
Market SuitabilityBest for range-bound or volatile marketsIdeal for trending markets
Signal GenerationRSI thresholds (30 & 70)MACD and signal line crossovers
Speed of SignalQuicker signals (less lag)Slower signals (more lag)
Calculation BasisMomentum oscillator (0–100 range)Difference of EMAs (12-period & 26-period)

To dive deeper into MACD divergence, see this detailed guide: Mastering MACD Divergence: Unlock Profitable Trades in Stocks, Cryptos, and ETFs.

Practical Tips for Traders

  1. Quick Signals with RSI: Utilize RSI divergence for fast trade signals, especially in volatile or sideways markets.
  2. Confirm with Other Indicators: Combine RSI divergence with MACD, candlestick patterns, or volume analysis to enhance accuracy.
  3. Adapt Strategies: Leverage RSI in range-bound markets, reserving MACD divergence for trending scenarios.
  4. Risk Management: Always set clear stop-loss and profit-taking strategies.
  5. Stay Flexible: Continuously update your analysis based on new market developments.

Conclusion

RSI divergence isn't just another technical signal—it's a trader’s early warning system. With the ability to detect momentum shifts before they fully play out on the charts, RSI divergence can help you catch reversals when they matter most.

Compared to MACD divergence, RSI gives quicker cues, especially in range-bound or volatile markets. It’s a valuable addition to any trader’s toolkit—whether you're fine-tuning entries or protecting profits.

If you're ready to put RSI divergence into action, tools like Kavout Smart Signals make it effortless. Kavout offers real-time market scans using RSI divergence signals across stocks, ETFs, and cryptocurrencies—helping you spot opportunities faster and with more confidence.

SHARE THIS ON:

Related Articles

Category

You may also like

Crypto News6 days ago

RSI Crashes to 16 as Bitcoin Consolidates Near $61,000 After $59.1K Low

Bitcoin rebounded above $61,600 after a weekend sell-off to a $59,100 low, with the RSI crashing to 16, signaling deeply oversold conditions.
Forex News3 weeks ago

AUD/USD Price Forecast: Stuck between key SMAs, RSI turns bearish

The AUD/USD pair remains range-bound between key simple moving averages (SMAs) as technical indicators shift. The Relative Strength Index (RSI) has turned bearish, signaling potential downward pressur...
News3 weeks ago

Bullish or Bearish? Retail vs The Russell 2000: Critical Market Levels To Watch

The Retail Sector ETF (XRT) shows weakening momentum amid consumer cost pressures, while the Russell 2000 ETF (IWM) maintains critical support levels. These diverging trends suggest potential volatili...
Crypto News3 weeks ago

DOGE Price Setup Turns Bullish as Hidden Divergence Pattern Emerges

DOGE price structure has shifted toward a bullish outlook as a hidden divergence pattern emerges on weekly charts. This technical setup mirrors historical accumulation phases that preceded significant...

Breaking News

View All →

Top Headlines

View More →
Stock News43 minutes ago

Rocket Lab Corporation (RKLB) Stock Drops Despite Market Gains: Important Facts to Note

Stock News1 hour ago

S&P 500 Snapshot: Late Week Rally Pushes Index Into Green

Stock News1 hour ago

How Elon Musk Just Became The World's First Trillionaire

Stock News2 hours ago

Could Tesla merge with SpaceX? The future of the space economy

Stock News2 hours ago

3 Core Artificial Intelligence (AI) Stocks to Buy With $1,000 Right Now and Hold for the Next Decade