
MarketLens
The Kavout Factor Difference – Value
Factor investing is more relevant today than ever before. At Kavout, we approach using Factors differently:
- We do the leg work. Kavout crunches the financial data, calculates and updates each value factor for thousands of stocks on a daily basis. This saves you time and resources to focus on manage wealth effectively and ultimately do more with less.
- Comprehensiveness. There are many value factors out there fully studied and researched. Quite importantly each factor has its timing and their performances rotate across time and sectors. Due to the limitation or accessibility, many managers and analysts only focus on a few value factors. By having access to more, you can discover previously hidden insights.
- A 360-degree view. Are you looking at a particular time period? A particular sector? A particular sector in a particular time period? Our data is as wide as it is deep. We are able to provide a 360-degree view of the factors and can slide-and-dice the data according to your needs.
A Quick Look
For this demonstration portfolio, we are comparing metrics between 2004 and 2019. The universe is the top 500 market-cap stocks, and the portfolio of each factor is constructed with the top 10% of stocks according to the corresponding factor ranking. Rebalancing occurs monthly, with 20 basis points as costs per transaction. We used market cap weighting, favoring Value, and used the SPY 500 as the benchmark for this scenario.
Cumulative Returns Comparison of Value Factors

Cumulative Returns Comparison of Value Factors

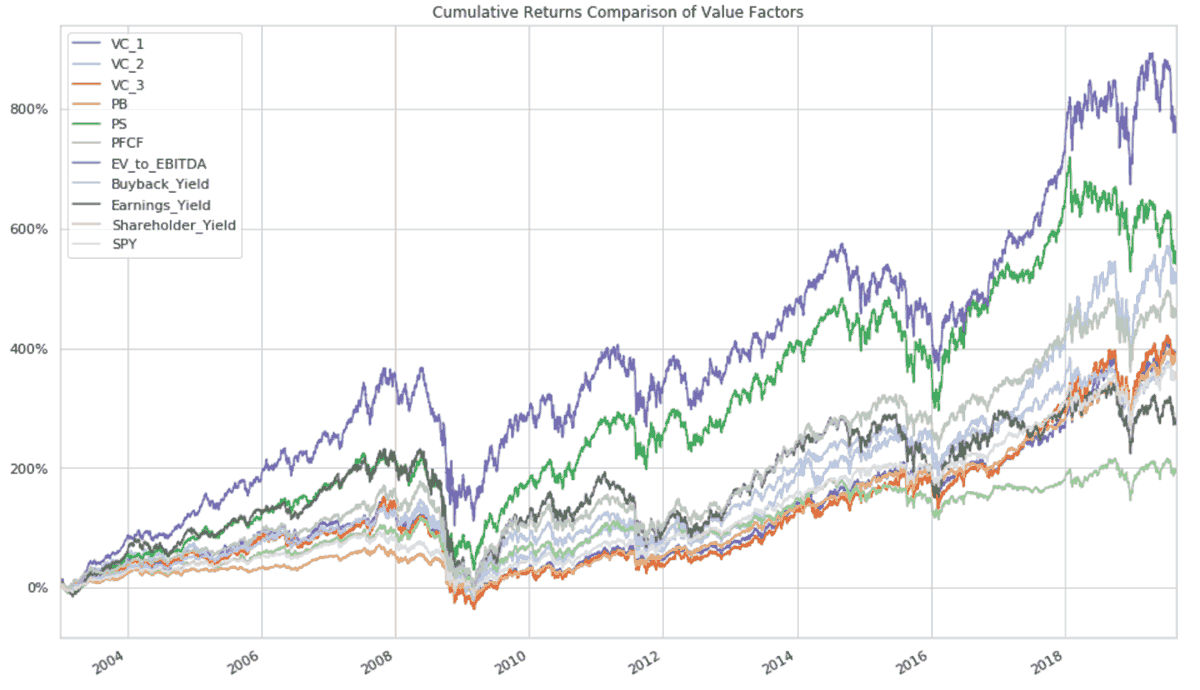
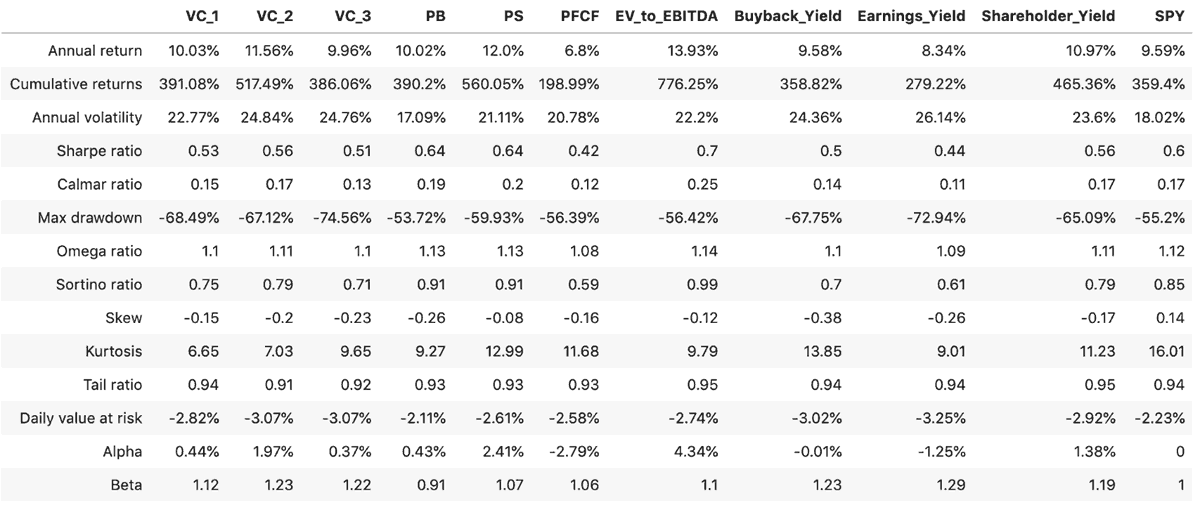
Kavout has the unique ability to provide comprehensive information on both individual and Ensemble Value Factors. Even though the information is for a limited time range, you are able to see the cumulative return for each value factor, and the composite value factors (VC1, VC2 and VC3) introduced by James O’Shaughnessy.
In the next blogs we break down the Value factor by sector and by time horizon.
Are you interested in seeing the latest performance of the value factor for the US stock market? Click below to learn more and download sample data for the value factor.
Related Articles
Category
You may also like


FVAL: GARP Tilt Secures Its Edge Over IVV (Rating Upgrade)

The Volatility Harvester That Thrives in Market Chaos

Kevin Davitt on NDX "Smart Money" & Index Rally Trends
Breaking News
View All →Featured Articles
Top Headlines
LinkedIn's AI hiring agents on track for $450 million in yearly revenue

Meta Q1: Thanks For The Dip, I'm Buying More

Amazon Offers Q1 Shoutout To ‘Project Hail Mary', Tops Wall Street Forecasts Amid AI Arms Race

Google's subscriptions business is booming — and AI is a big reason


