In the last blog we looked at the Value factor without any particular perspective. In this entry, we break down the data and see how different Value factors perform across different sectors.
To remind you, for this demonstration portfolio we are comparing metrics between 2004 and 2019. The universe is the top 500 stocks with the largest market-cap, and the overall portfolio uses the top 10% ranked by corresponding value factors. Rebalancing occurs monthly, with 20 basis points as costs per transaction. We used Cap weighting, favoring Value, and used the SPY 500 as the benchmark for this scenario.
Like the last blog entry, we provide information on both individual and Ensemble Value Factors. We include the cumulative return for each value factor and the combinations of those factors (VC1, VC2 and VC3).
The heat map below is the portfolio for the different value factors based on sector, and what becomes immediately evident is that there are some sectoral biases. For example, the Price-to-Sale ratio for the Industrial and Materials sectors stand out.
Cumulative Returns Value Metrics Comparison by Sector
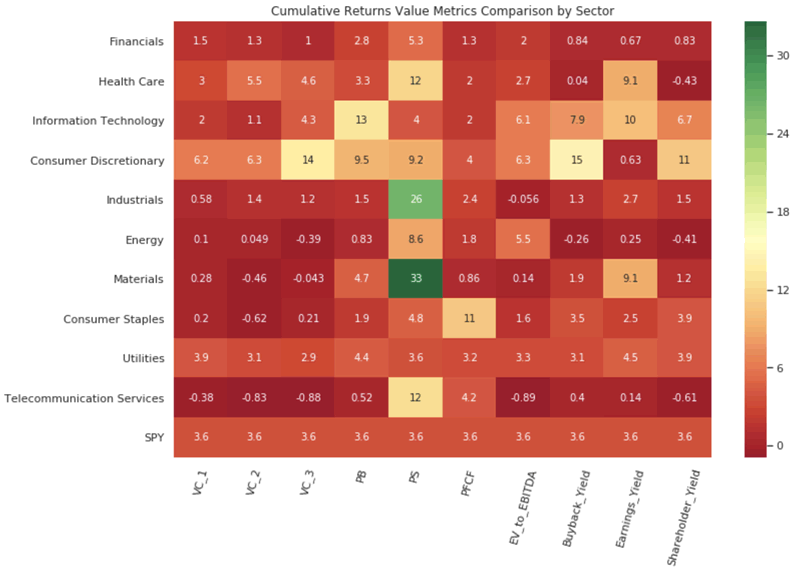
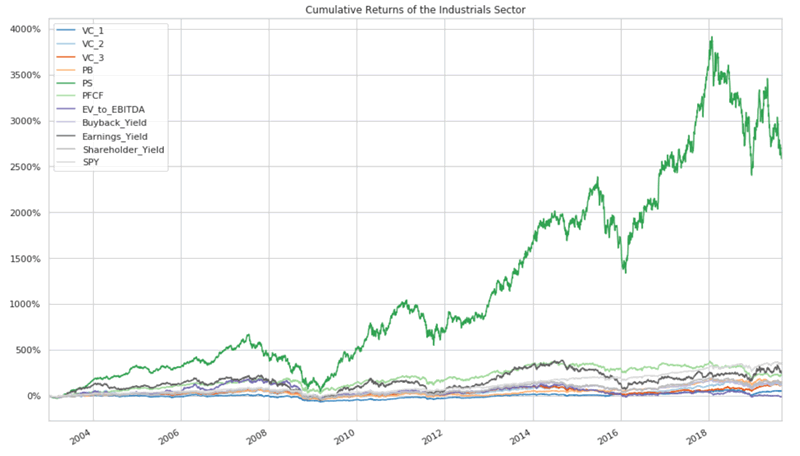
The key point is that particular value factors tend to focus on specific sectors. This also means that particular Ensemble Value Factors combinations will work better for some. For example, below is the information for the Industrial sector. For example, we see the preference of Price-to-Sale (P/S) for the Industrial sector.
Cumulative Returns of the Industrials Sector
Kavout has the luxury of being able to break down information according to the specific needs of the investor. Click here to read our blog on the Value Factor by Time Horizons.
Are you interested in seeing the latest performance of the value factor for the US stock market? Click below to learn more and download sample data for the value factor.