In the previous two blogs we looked at Value from a high level and from a sector perspective. In this entry, we are looking at Value from a time horizon. Given the pro-cyclical nature of the Value factor, this is an important facet to have.
As a refresher, for this demonstration portfolio we are comparing metrics between 2010 and 2019. The universe is the top 500 stocks with the largest market-cap, and the overall portfolio uses the top 10% of the corresponding value factor. Rebalancing occurs monthly, with 20 basis points as costs per transaction. We used Cap weighting, favoring Value, and used the SPY 500 as the benchmark for this scenario.
Like the last two blog entries, we provide information on both individual and Ensemble Value Factors. We include the cumulative return for each value factor and the combinations of those factors (VC1, VC2 and VC3).
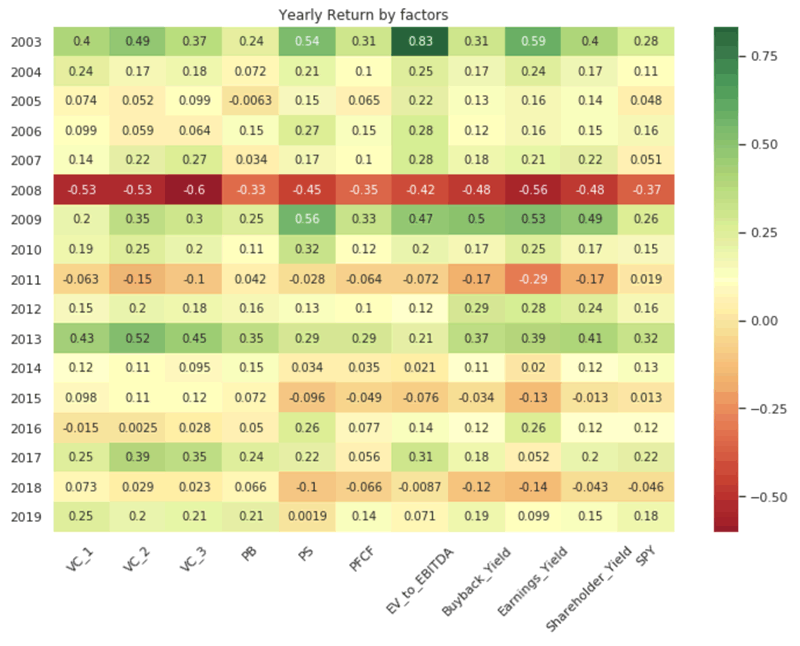
Below is a heat map demonstrating the yearly return based on the Value factors.
Yearly Return by Factors
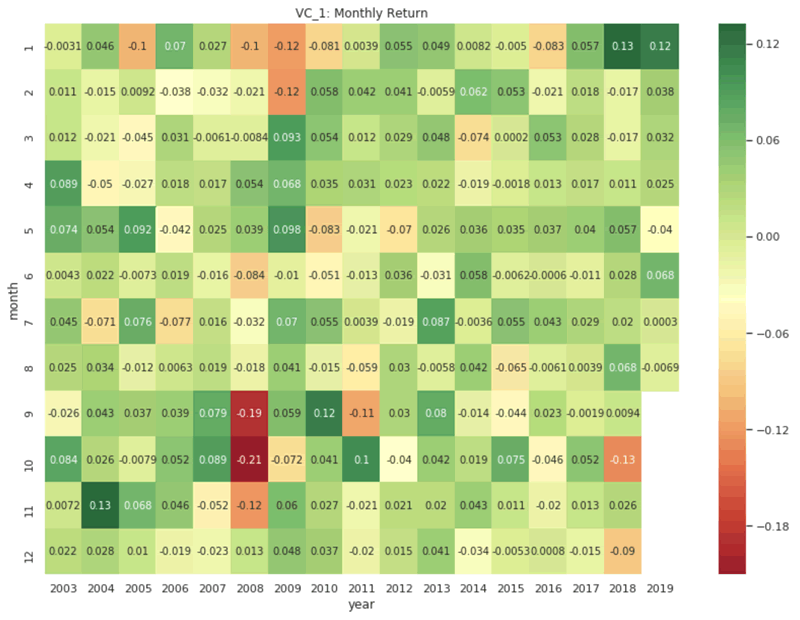
To drill down into more granular detail, below is a month-by-month return view between 2003 and 2019. For illustrative purposes we have provided the monthly returns for VC1, the best performing Value factor we identified.
VC_1:Monthly Return
Being able to have a comprehensive view of Value through time horizons is a strength of Kavout: our specialty lies not only in the breadth and depth of data, but also the ability to offer new perspectives and slice-and-dice the information according to your needs. By doing this, we are not trying to replace the human investor – we strive to make the human investor better.
Are you interested in seeing the latest performance of the value factor for the US stock market? Click below to learn more and download sample data for the value factor.