Technical Analysis of ACU 2024-05-31
Overview:
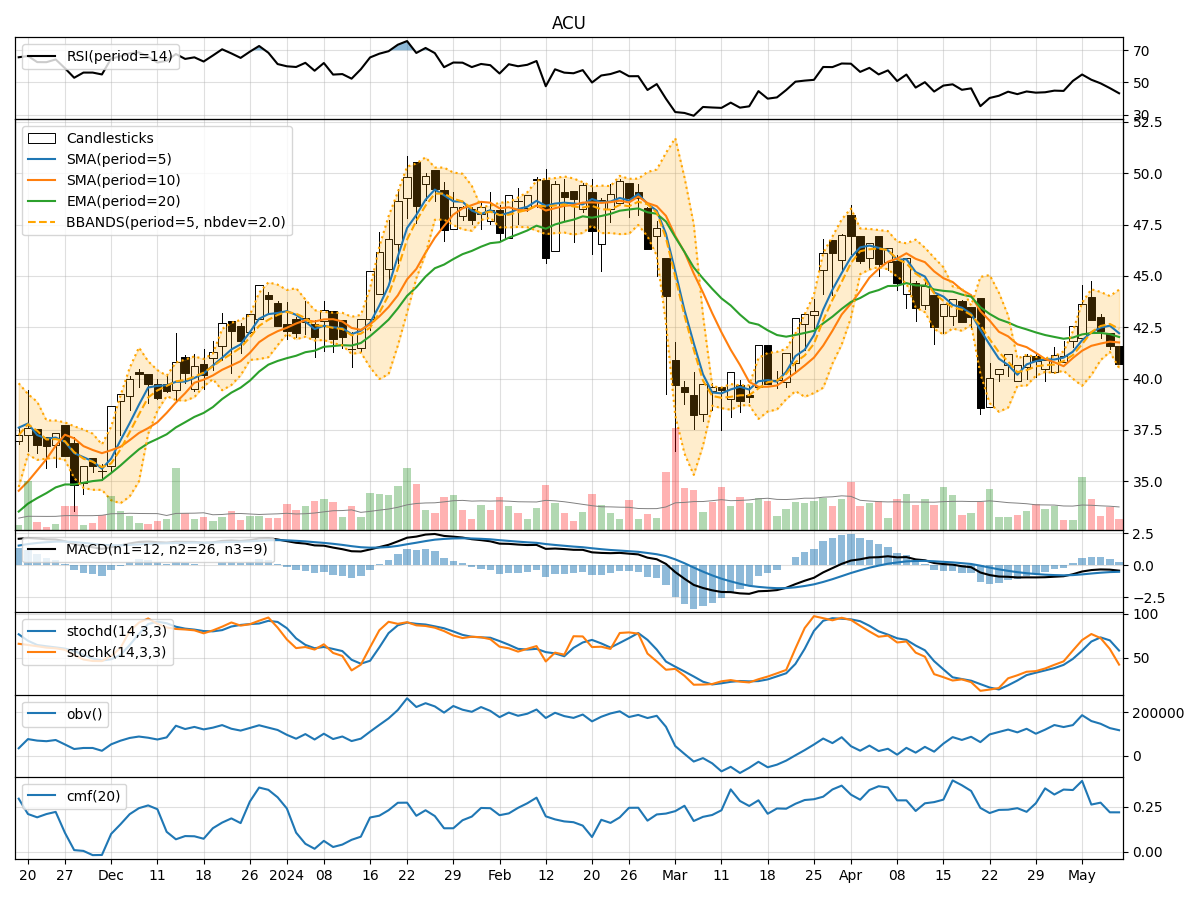
In analyzing the technical indicators for ACU over the last 5 days, we will delve into the trend, momentum, volatility, and volume indicators to provide a comprehensive assessment of the stock's potential price movement. By examining these key factors, we aim to offer valuable insights and predictions for the next few days.
Trend Analysis:
- Moving Averages (MA): The 5-day MA has been consistently below the closing price, indicating a short-term bearish trend.
- MACD: The MACD line has been decreasing, with the MACD line crossing below the signal line, signaling a bearish trend.
- EMA: The EMA has been trending downwards, further supporting the bearish sentiment.
Momentum Analysis:
- RSI: The RSI has been declining and is currently below 30, suggesting the stock is oversold.
- Stochastic Oscillator: Both %K and %D have been decreasing, indicating weakening momentum.
- Williams %R: The indicator is in the oversold territory, signaling a potential reversal.
Volatility Analysis:
- Bollinger Bands (BB): The stock price has been consistently below the lower Bollinger Band, indicating oversold conditions.
- Bollinger Band Width (BBW): The BBW has been widening, suggesting increased volatility.
- Bollinger Band %B (BBP): The %B is below 0.2, indicating a potential bounce back.
Volume Analysis:
- On-Balance Volume (OBV): The OBV has been declining, suggesting distribution of the stock.
- Chaikin Money Flow (CMF): The CMF has been negative, indicating selling pressure.
Conclusion:
Based on the analysis of the technical indicators, the stock ACU is currently in a bearish phase. The trend indicators, momentum oscillators, volatility measures, and volume indicators all point towards a downward movement in the stock price in the next few days. Traders and investors should exercise caution and consider shorting or staying away from long positions until there are clear signs of a reversal in the technical indicators.