Technical Analysis of AMBI 2024-05-10
Overview:
In analyzing the technical indicators for AMBI stock over the last 5 days, we will delve into the trend, momentum, volatility, and volume indicators to provide a comprehensive assessment of the stock's potential price movement. By examining these key factors, we aim to offer valuable insights and predictions for the next few days.
Trend Analysis:
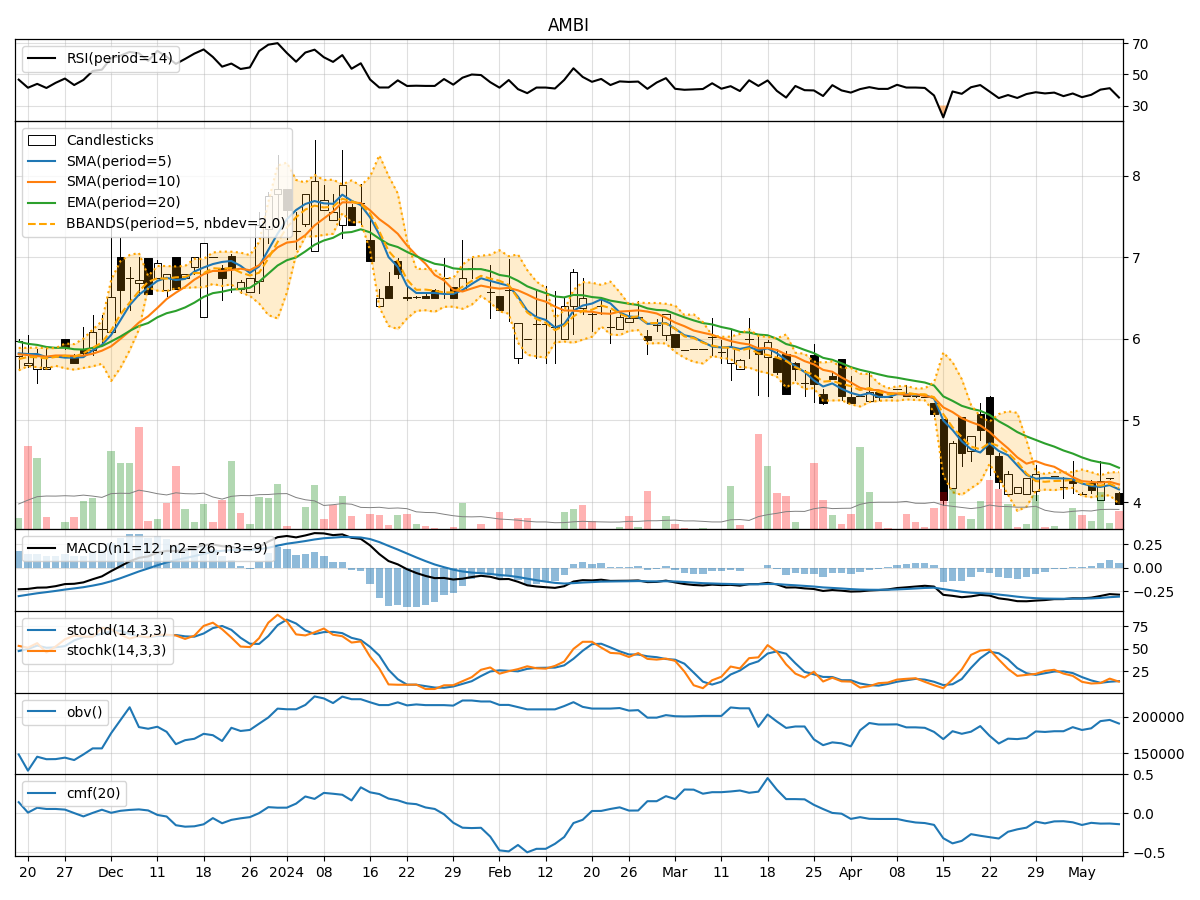
- Moving Averages (MA): The 5-day MA has been fluctuating around the closing prices, indicating short-term price trends. The stock has been trading below the 10-day SMA, suggesting a bearish sentiment.
- Exponential Moving Average (EMA): The 20-day EMA has been trending downwards, reflecting a bearish momentum in the stock's price.
- Moving Average Convergence Divergence (MACD): The MACD line has been consistently below the signal line, indicating a bearish trend in the stock.
Momentum Analysis:
- Relative Strength Index (RSI): The RSI has been hovering around 35-41, indicating a neutral to slightly bearish momentum in the stock.
- Stochastic Oscillator: Both %K and %D have been fluctuating in the oversold territory, suggesting a potential reversal or consolidation phase.
- Williams %R (Willams %R): The Williams %R has been consistently in the oversold region, signaling a bearish sentiment.
Volatility Analysis:
- Bollinger Bands (BB): The stock price has been moving within the lower Bollinger Band, indicating a potential oversold condition.
Volume Analysis:
- On-Balance Volume (OBV): The OBV has been negative, suggesting a higher selling pressure in the stock.
- Chaikin Money Flow (CMF): The CMF has been negative, indicating a bearish money flow in the stock.
Key Observations:
- The stock is currently in a bearish trend based on moving averages and MACD.
- Momentum indicators suggest a neutral to slightly bearish sentiment.
- Volatility is relatively low, indicating a potential consolidation phase.
- Volume indicators reflect higher selling pressure in the stock.
Conclusion:
Based on the analysis of technical indicators, the next few days for AMBI stock are likely to see further downward movement. The bearish trend indicated by moving averages and MACD, coupled with oversold conditions in momentum indicators, suggests a continuation of the current downtrend. Traders and investors should exercise caution and consider short-term selling strategies or wait for a clear reversal signal before considering long positions.