Technical Analysis of ARMN 2024-05-10
Overview:
In analyzing the technical indicators for ARMN over the last 5 days, we will delve into the trend, momentum, volatility, and volume indicators to provide a comprehensive outlook on the possible stock price movement in the coming days.
Trend Analysis:
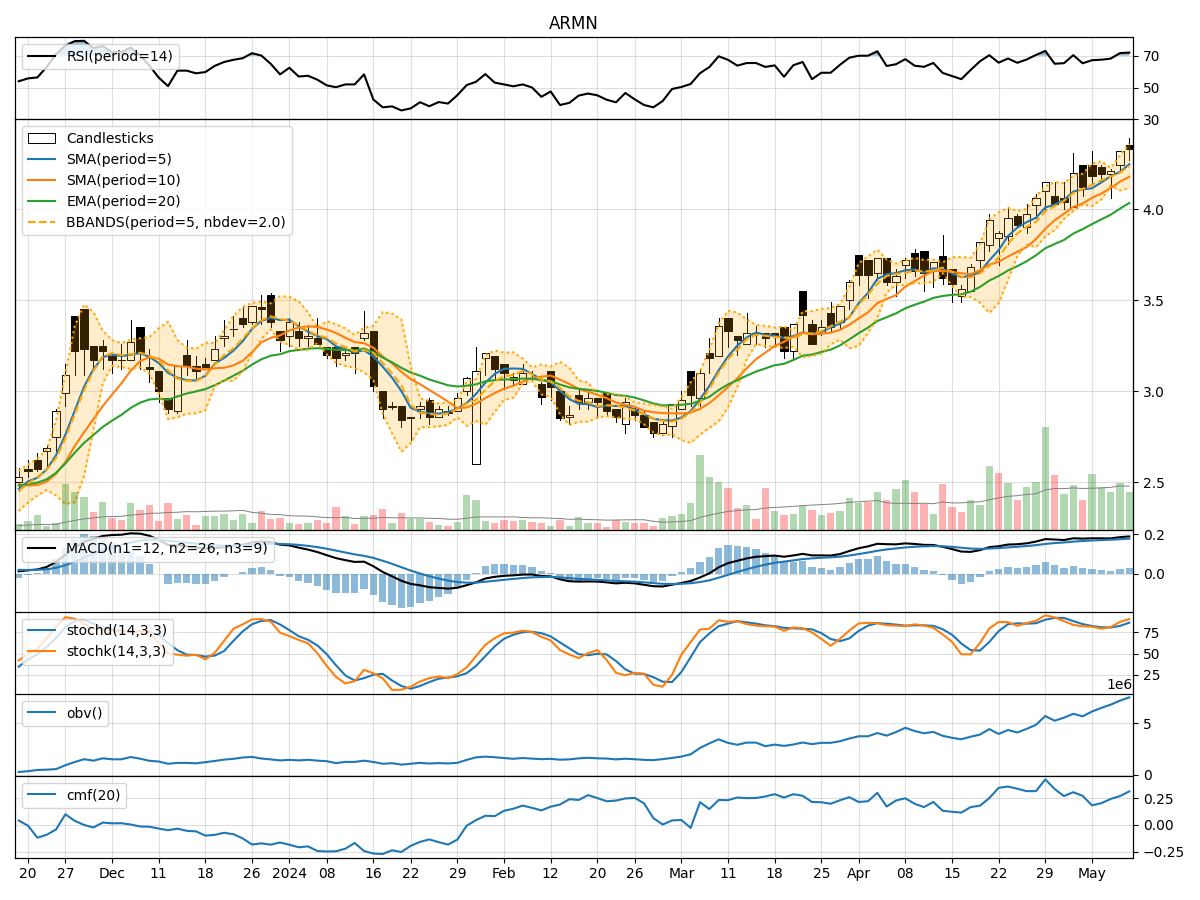
- Moving Averages (MA): The 5-day MA has been consistently above the closing prices, indicating an upward trend. This suggests that the stock price has been trending higher over the past few days.
- MACD: The MACD line has been above the signal line, with both lines showing an upward trajectory. This confirms the bullish momentum in the stock.
Momentum Analysis:
- RSI: The RSI values have been increasing, with the latest value above 70, indicating the stock is in overbought territory. This could potentially lead to a short-term pullback or consolidation.
- Stochastic Oscillator: Both %K and %D values are in the overbought zone, suggesting that the stock may be due for a reversal or correction.
Volatility Analysis:
- Bollinger Bands (BB): The stock price has been trading within the upper Bollinger Band, indicating high volatility. The bands are widening, which could signal increased price fluctuations in the near term.
Volume Analysis:
- On-Balance Volume (OBV): The OBV has been steadily increasing, indicating positive buying pressure in the stock. This aligns with the upward trend seen in the price movement.
- Chaikin Money Flow (CMF): The CMF is also positive, reflecting strong buying interest in the stock over the past 20 days.
Conclusion:
Based on the analysis of the technical indicators, the stock of ARMN is currently exhibiting bullish momentum supported by the trend, volume, and volatility indicators. However, the overbought conditions highlighted by the RSI and Stochastic Oscillator suggest a potential short-term correction or consolidation in the stock price.
Recommendation:
Considering the overall bullish sentiment but acknowledging the overbought conditions, investors should be cautious of a possible pullback in the stock price. It would be prudent to wait for a retracement before considering entry positions. Keep a close eye on the RSI and Stochastic Oscillator for signals of reversal or correction.
Key Takeaways:
- Upward Trend: Bullish momentum supported by moving averages and MACD.
- Overbought Conditions: RSI and Stochastic Oscillator signaling caution.
- Volatility: High volatility with widening Bollinger Bands.
- Volume: Positive OBV and CMF indicating buying interest.
Overall Outlook:
The next few days for ARMN could see a potential pullback or consolidation after the recent bullish run. Investors should monitor key indicators closely for signs of a reversal or correction in the stock price.