Technical Analysis of ASM 2024-05-10
Overview:
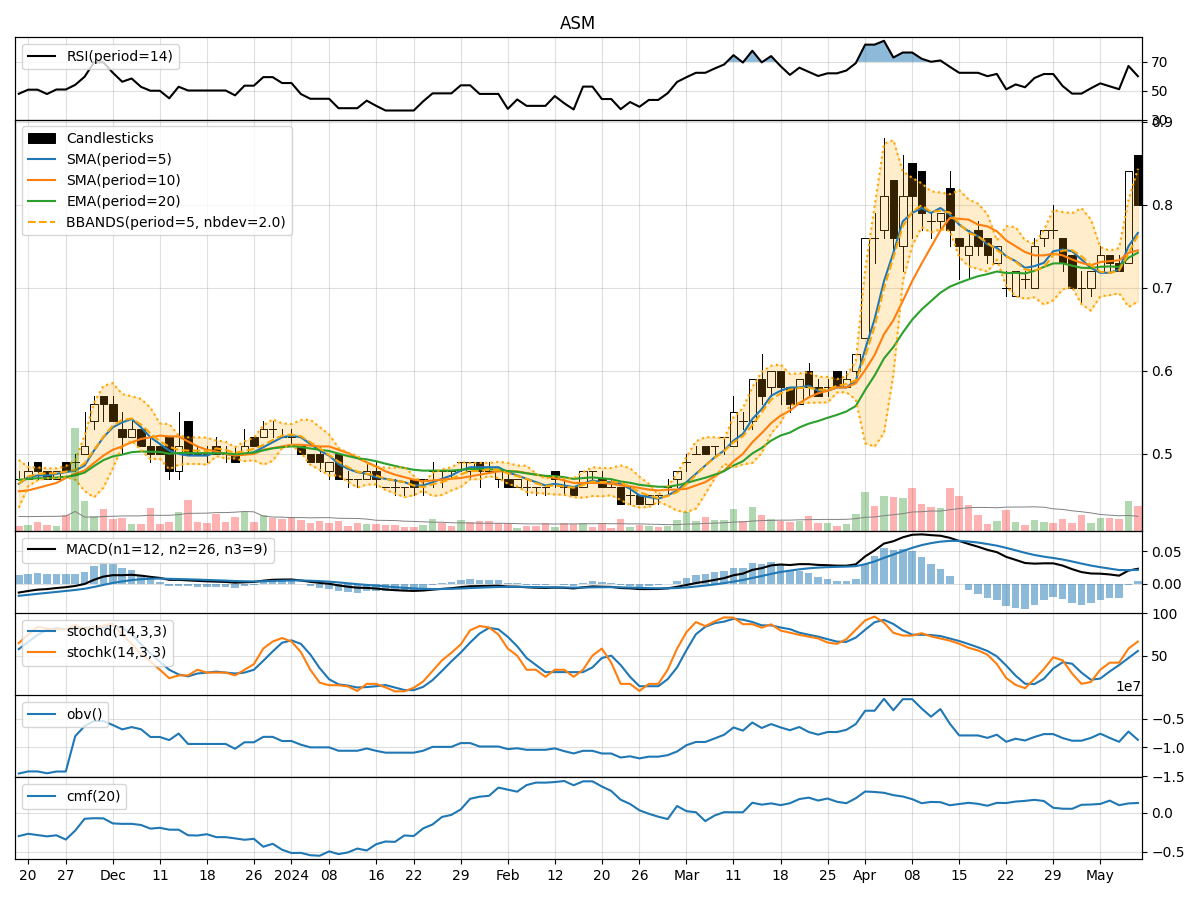
In analyzing the technical indicators for ASM stock over the last 5 days, we will delve into the trend, momentum, volatility, and volume indicators to provide a comprehensive outlook on the possible stock price movement in the coming days. By examining these key indicators, we aim to offer valuable insights and recommendations for potential investors.
Trend Analysis:
- Moving Averages (MA): The 5-day Moving Average (MA) has been showing an upward trend, indicating a positive momentum in the stock price.
- MACD: The Moving Average Convergence Divergence (MACD) has been consistently positive, suggesting a bullish trend in the stock.
- EMA: The Exponential Moving Average (EMA) has been trending upwards, supporting the bullish sentiment in the stock.
Momentum Analysis:
- RSI: The Relative Strength Index (RSI) has been fluctuating but generally staying within the neutral range, indicating a balanced momentum in the stock.
- Stochastic Oscillator: The Stochastic Oscillator has shown some overbought conditions but has not reached extreme levels, suggesting a potential continuation of the current trend.
Volatility Analysis:
- Bollinger Bands: The Bollinger Bands have widened, indicating increased volatility in the stock price.
- Volatility Percentage (BBP): The Bollinger Bands Percentage (BBP) has been fluctuating, reflecting the changing volatility levels in the stock.
Volume Analysis:
- On-Balance Volume (OBV): The On-Balance Volume has shown mixed signals, with fluctuations in volume accumulation.
- Chaikin Money Flow (CMF): The Chaikin Money Flow has been positive, indicating buying pressure in the stock.
Key Observations:
- The trend indicators suggest a bullish sentiment in ASM stock, supported by positive moving averages and MACD.
- Momentum indicators show a balanced momentum with potential for further upside based on the Stochastic Oscillator.
- Volatility has increased, indicating potential price swings in the coming days.
- Volume indicators show mixed signals, with OBV fluctuating and CMF indicating buying pressure.
Conclusion:
Based on the analysis of the technical indicators, the next few days' possible stock price movement for ASM is likely to be* upward *with a bullish bias. The positive trend indicators, balanced momentum, and increased volatility suggest potential for further price appreciation. However, investors should closely monitor the volume dynamics to confirm the strength of the bullish trend. Overall, the technical analysis points towards a favorable outlook for ASM stock in the near term.