Technical Analysis of BTG 2024-05-10
Overview:
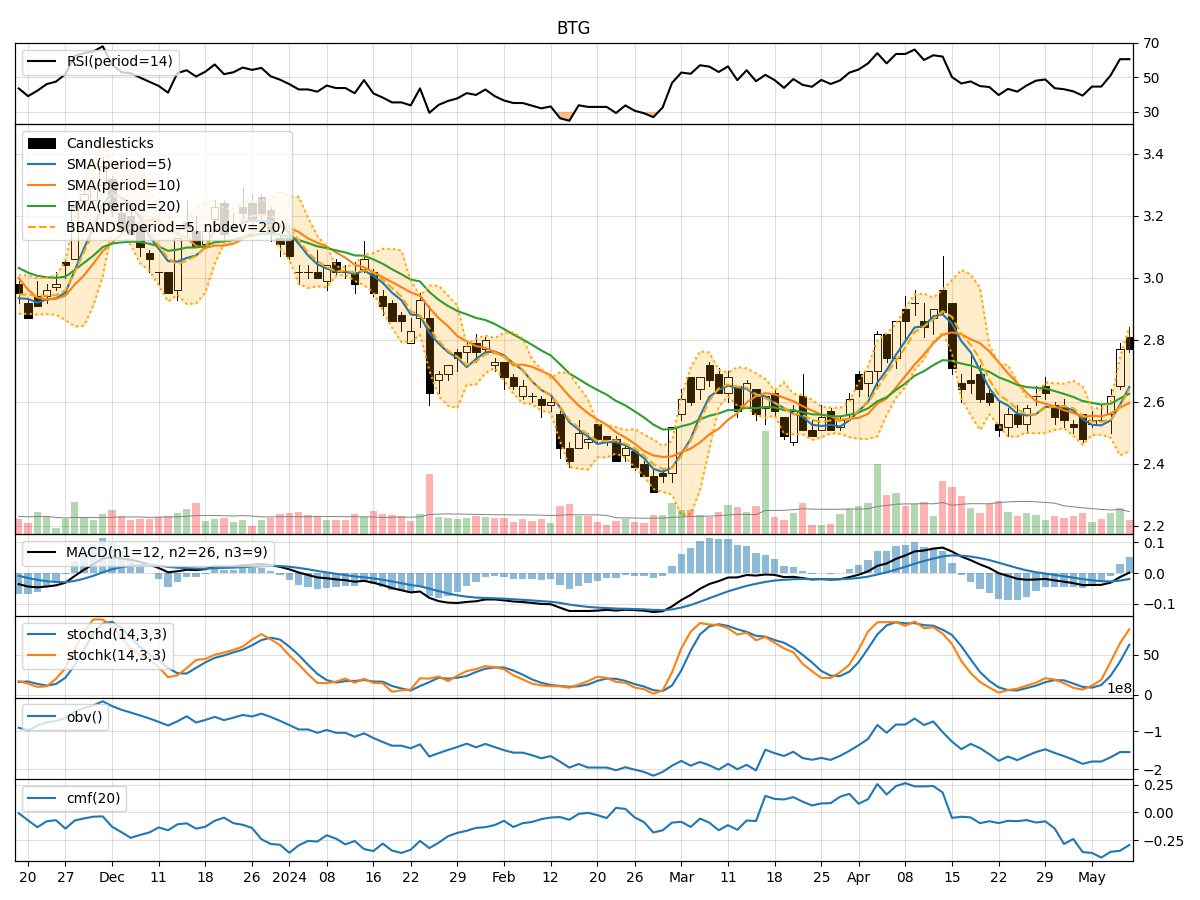
In analyzing the technical indicators for BTG over the last 5 days, we will delve into the trend, momentum, volatility, and volume indicators to provide a comprehensive outlook on the possible stock price movement in the coming days. By examining these key aspects, we aim to offer valuable insights and recommendations for potential investors.
Trend Analysis:
- Moving Averages (MA): The 5-day Moving Average (MA) has been fluctuating around the closing prices, indicating a lack of clear trend direction.
- MACD: The Moving Average Convergence Divergence (MACD) has shown a slight positive trend, with the MACD line crossing above the signal line on the last day.
- EMA: The Exponential Moving Average (EMA) has been relatively stable, suggesting a potential consolidation phase.
Momentum Analysis:
- RSI: The Relative Strength Index (RSI) has been gradually increasing, indicating strengthening momentum.
- Stochastic Oscillator: Both %K and %D have been rising consistently, signaling increasing buying pressure.
- Williams %R: The Williams %R has shown a slight improvement but remains in the oversold territory.
Volatility Analysis:
- Bollinger Bands: The Bollinger Bands have widened, suggesting increased price volatility.
- Bollinger %B: The %B indicator has been fluctuating within the bands, indicating potential price reversals.
Volume Analysis:
- On-Balance Volume (OBV): The OBV has shown a positive divergence, indicating accumulation by investors.
- Chaikin Money Flow (CMF): The CMF has been negative, suggesting some selling pressure in the market.
Key Observations:
- The trend indicators show a potential consolidation phase with a slight positive bias.
- Momentum indicators suggest a strengthening bullish momentum.
- Volatility indicators point towards increased price fluctuations.
- Volume indicators indicate a mix of accumulation and selling pressure.
Conclusion:
Based on the analysis of the technical indicators, the next few days for BTG could see further upward movement in stock prices. The strengthening momentum, positive MACD crossover, and accumulation indicated by OBV are supportive of a bullish view. However, investors should remain cautious of the increased volatility highlighted by the Bollinger Bands and monitor for any signs of reversal in the %B indicator. Overall, the outlook for BTG appears bullish in the short term.