Technical Analysis of CANF 2024-05-10
Overview:
In analyzing the technical indicators for CANF over the last 5 days, we will delve into the trend, momentum, volatility, and volume indicators to provide a comprehensive outlook on the possible stock price movement in the coming days. By examining these key aspects, we aim to offer valuable insights and predictions for potential investors.
Trend Analysis:
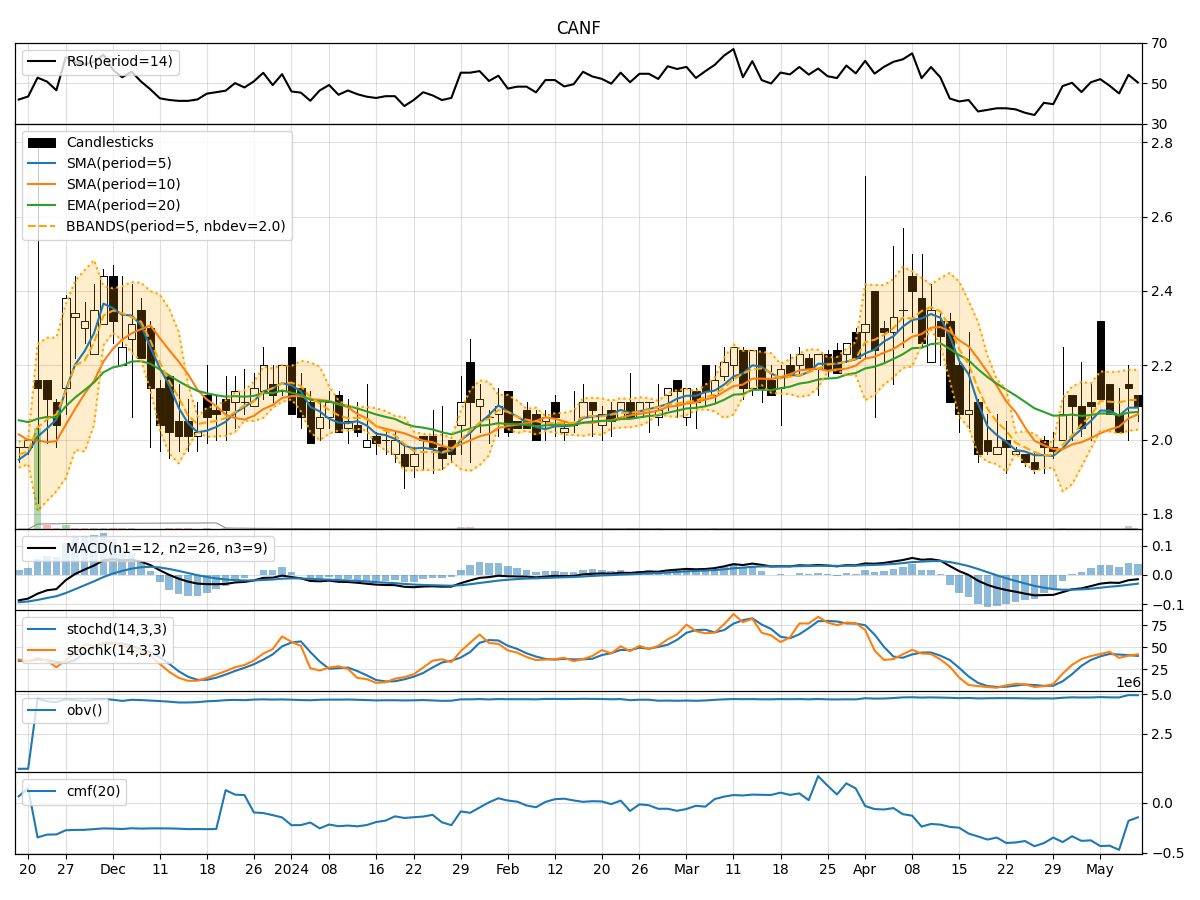
- Moving Averages (MA): The 5-day Moving Average (MA) has been relatively stable around the closing prices, indicating a short-term trend. The Simple Moving Average (SMA) and Exponential Moving Average (EMA) have shown a slight downward trend, suggesting a potential bearish sentiment.
- MACD: The Moving Average Convergence Divergence (MACD) has been negative over the past 5 days, with the MACD line consistently below the signal line. This indicates a bearish trend in the stock price.
- Conclusion: The trend indicators point towards a bearish outlook for CANF in the near term.
Momentum Analysis:
- RSI: The Relative Strength Index (RSI) has been fluctuating around the 50 level, indicating a lack of strong momentum in either direction.
- Stochastic Oscillator: Both %K and %D of the Stochastic Oscillator have been hovering in the neutral zone, suggesting a balanced momentum between buyers and sellers.
- Conclusion: The momentum indicators suggest a sideways movement or lack of a clear trend in the stock price.
Volatility Analysis:
- Bollinger Bands: The Bollinger Bands have shown a narrowing of the bands, indicating decreasing volatility in the stock price.
- Conclusion: The volatility indicators suggest a consolidation phase with reduced price fluctuations.
Volume Analysis:
- On-Balance Volume (OBV): The OBV has shown mixed movements, indicating indecision among market participants regarding the stock.
- Chaikin Money Flow (CMF): The CMF has been negative, reflecting selling pressure in the stock.
- Conclusion: The volume indicators suggest a neutral to bearish sentiment among investors.
Overall Conclusion:
Based on the analysis of trend, momentum, volatility, and volume indicators, the overall outlook for CANF in the next few days is bearish with a potential for sideways movement. The trend indicators signal a bearish sentiment, while the momentum indicators suggest a lack of clear direction. Volatility indicators point towards a consolidation phase, and volume indicators indicate a neutral to bearish sentiment among investors.
Recommendation:
Considering the comprehensive analysis of technical indicators, it is advisable to exercise caution when trading CANF in the coming days. Investors may consider waiting for more clarity in the market dynamics before making significant trading decisions. Short-term traders could potentially benefit from range-bound strategies, while long-term investors may want to monitor the stock closely for a clearer trend to emerge before taking positions.
Disclaimer:
This analysis is based solely on technical indicators and historical data, and it is essential to consider other fundamental factors and market dynamics before making investment decisions. Market conditions can change rapidly, impacting stock prices unpredictably. It is recommended to conduct thorough research and consult with a financial advisor before making any investment choices.