Technical Analysis of COHN 2024-05-31
Overview:
In analyzing the technical indicators for COHN over the last 5 days, we will delve into the trend, momentum, volatility, and volume indicators to provide a comprehensive outlook on the possible stock price movement. By examining these key aspects, we aim to offer valuable insights and predictions for the upcoming days.
Trend Analysis:
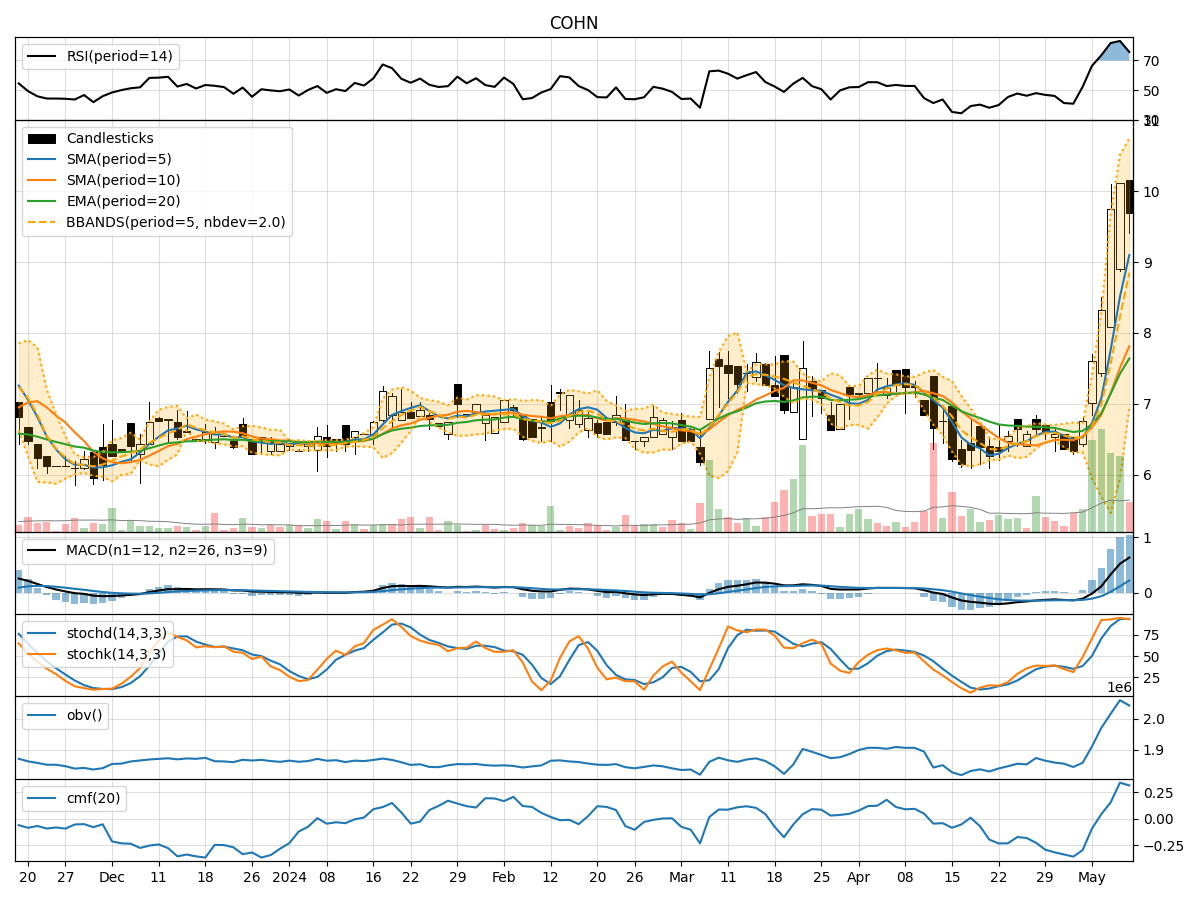
- Moving Averages (MA): The 5-day Moving Average (MA) has been fluctuating around the actual closing prices, indicating short-term price trends. The Simple Moving Average (SMA) and Exponential Moving Average (EMA) show an upward trend, suggesting a bullish sentiment.
- MACD: The Moving Average Convergence Divergence (MACD) and its signal line have been consistently positive, indicating a bullish momentum in the stock price.
Momentum Analysis:
- RSI: The Relative Strength Index (RSI) has been hovering around the 60-70 range, indicating a moderate bullish momentum.
- Stochastic Oscillator: Both %K and %D lines of the Stochastic Oscillator are in the overbought zone, suggesting a potential reversal or consolidation.
Volatility Analysis:
- Bollinger Bands (BB): The Bollinger Bands have been widening, indicating increased volatility in the stock price. The current price is closer to the upper band, suggesting a potential overbought scenario.
Volume Analysis:
- On-Balance Volume (OBV): The OBV has shown a slight increase over the last 5 days, indicating a positive accumulation of volume.
- Chaikin Money Flow (CMF): The CMF has been steadily rising, indicating buying pressure in the stock.
Key Observations:
- The trend indicators suggest a bullish sentiment with moving averages pointing upwards.
- Momentum indicators show a moderate bullish momentum but with signs of potential overbought conditions.
- Volatility has increased, indicating potential price swings.
- Volume indicators reflect positive accumulation and buying pressure.
Conclusion:
Based on the analysis of the technical indicators, the next few days' possible stock price movement for COHN is likely to experience a short-term pullback or consolidation. The stock has shown signs of being overbought, coupled with increased volatility, which may lead to a temporary pause in the upward trend. Traders should exercise caution and consider potential profit-taking opportunities in the near term.