Technical Analysis of DLA 2024-05-31
Overview:
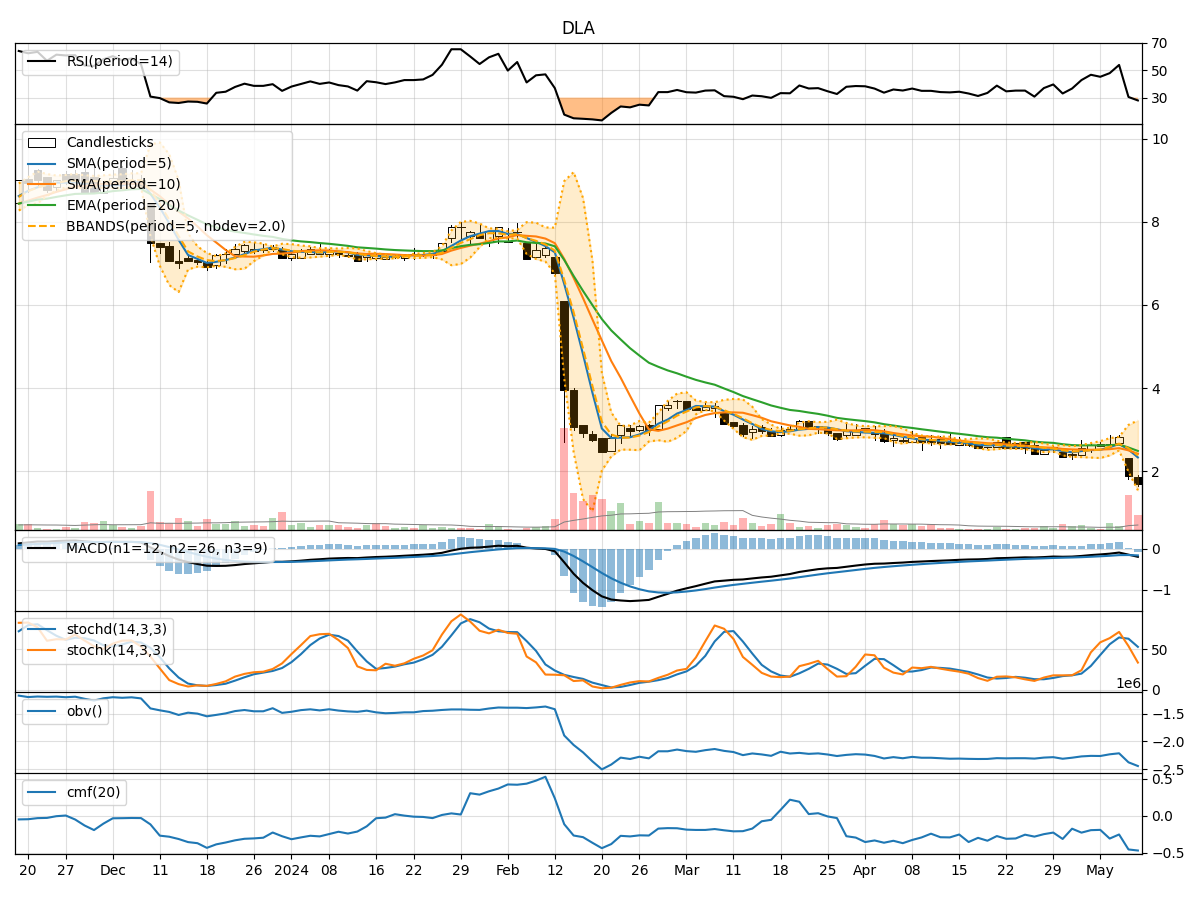
In analyzing the technical indicators for DLA stock over the last 5 days, we will delve into the trend, momentum, volatility, and volume indicators to provide a comprehensive outlook on the possible stock price movement in the upcoming days. By examining these key indicators, we aim to offer valuable insights and predictions for informed decision-making.
Trend Analysis:
- Moving Averages (MA): The 5-day MA has been consistently decreasing, indicating a downward trend in the stock price.
- MACD: The MACD line has been negative and decreasing, suggesting bearish momentum in the stock.
- EMA: The EMA has been declining, further supporting the bearish trend in the stock.
Momentum Analysis:
- RSI: The RSI has been relatively low, indicating oversold conditions in the stock.
- Stochastic Oscillator: Both %K and %D have been trending downwards, signaling weakening momentum.
- Williams %R: The indicator has been in the oversold territory, suggesting a potential reversal or bounce.
Volatility Analysis:
- Bollinger Bands (BB): The stock price has been trading below the lower Bollinger Band, indicating oversold conditions.
- Bollinger Band Width (BBW): The BBW has been expanding, suggesting increased volatility in the stock.
- Bollinger Band %B (BBP): The %B has been below 0.2, indicating an oversold condition.
Volume Analysis:
- On-Balance Volume (OBV): The OBV has been declining, reflecting selling pressure in the stock.
- Chaikin Money Flow (CMF): The CMF has been negative, indicating outflow of money from the stock.
Key Observations:
- The stock is currently in a downtrend based on moving averages and MACD.
- Momentum indicators suggest oversold conditions, potentially hinting at a reversal.
- Volatility has increased, with the stock trading below the lower Bollinger Band.
- Volume indicators reflect selling pressure and negative money flow.
Conclusion:
Based on the analysis of the technical indicators, the next few days for DLA stock are likely to see a potential reversal or consolidation. The stock has been in oversold territory, and with volatility increasing, there could be a bounce back in the stock price. However, it is crucial to monitor the price action closely for any signs of a trend reversal. Consider a cautious approach and wait for confirmation of a bullish reversal before considering any long positions.