Technical Analysis of EMX 2024-05-10
Overview:
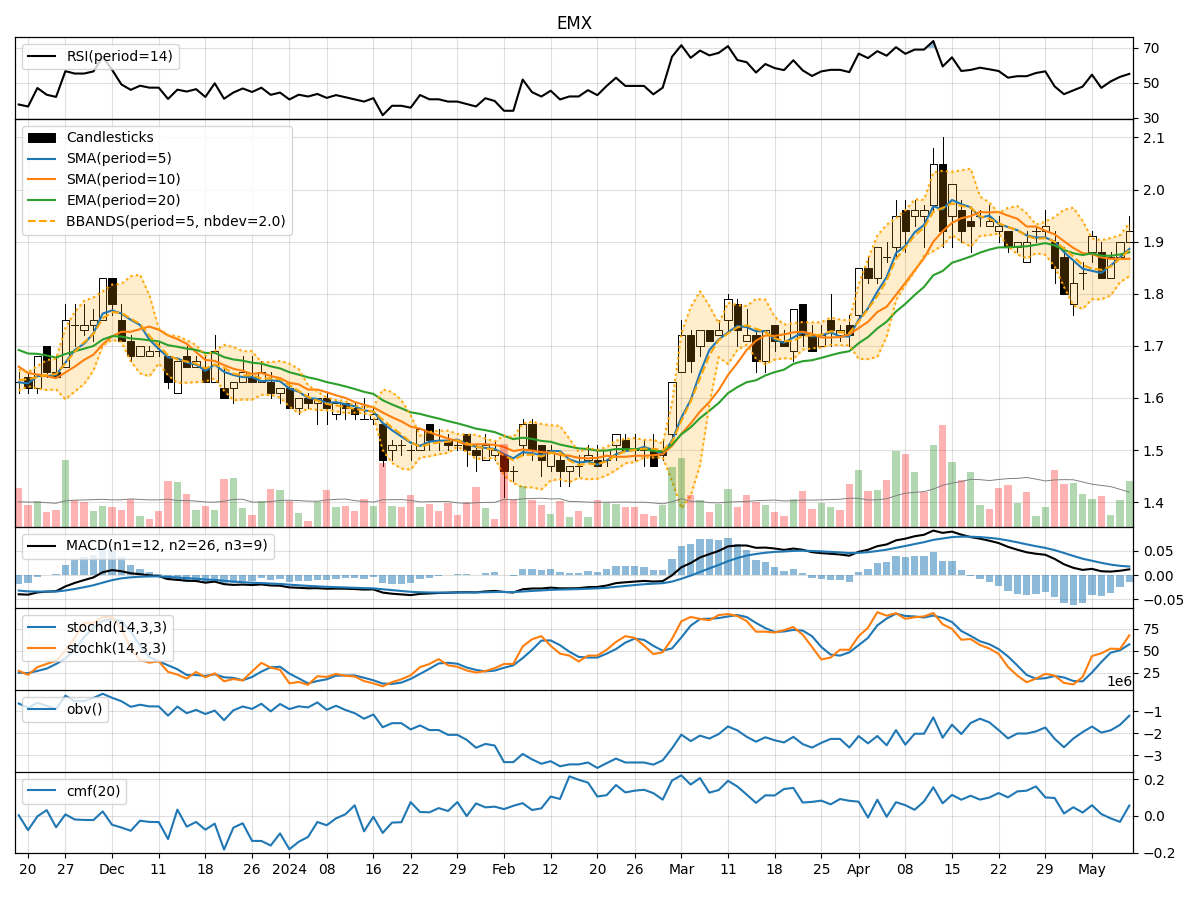
In analyzing the technical indicators for EMX stock over the last 5 days, we will delve into the trend, momentum, volatility, and volume indicators to provide a comprehensive outlook on the possible stock price movement in the coming days. By examining these key indicators, we aim to offer valuable insights and make informed predictions regarding the future direction of EMX stock.
Trend Analysis:
- The moving averages (MA) show a slight uptrend, with the 5-day MA consistently above the 10-day simple moving average (SMA).
- The exponential moving average (EMA) has been gradually increasing, indicating a positive trend in the stock price.
- The Moving Average Convergence Divergence (MACD) is positive, with the MACD line above the signal line, suggesting bullish momentum.
Momentum Analysis:
- The Relative Strength Index (RSI) is in the neutral zone, indicating neither overbought nor oversold conditions.
- The Stochastic Oscillator shows a recent uptrend, with both %K and %D lines moving higher.
- The Williams %R (WILLR) is also in the neutral territory, not signaling any extreme conditions.
Volatility Analysis:
- The Bollinger Bands (BB) are widening, suggesting increased volatility in the stock price.
- The upper and lower bands are expanding, indicating potential price fluctuations in the near term.
Volume Analysis:
- On-Balance Volume (OBV) has been increasing, reflecting positive buying pressure in the stock.
- The Chaikin Money Flow (CMF) is slightly positive, indicating money flow into the stock over the past 20 days.
Key Observations:
- The trend indicators suggest a bullish sentiment, supported by the positive MACD and EMA trends.
- Momentum indicators show a neutral stance, with RSI and Williams %R not indicating any extreme conditions.
- Volatility is increasing, as seen in the widening Bollinger Bands, which could lead to significant price movements.
- Volume indicators reflect positive buying pressure, as evidenced by the rising OBV and slightly positive CMF.
Conclusion:
Based on the analysis of the technical indicators, the stock price of EMX is likely to continue its upward trajectory in the coming days. The bullish trend supported by the positive MACD and EMA, coupled with increasing buying pressure indicated by volume indicators, suggests a favorable outlook for EMX stock. Traders and investors may consider buying opportunities in EMX, anticipating further price appreciation in the near term.