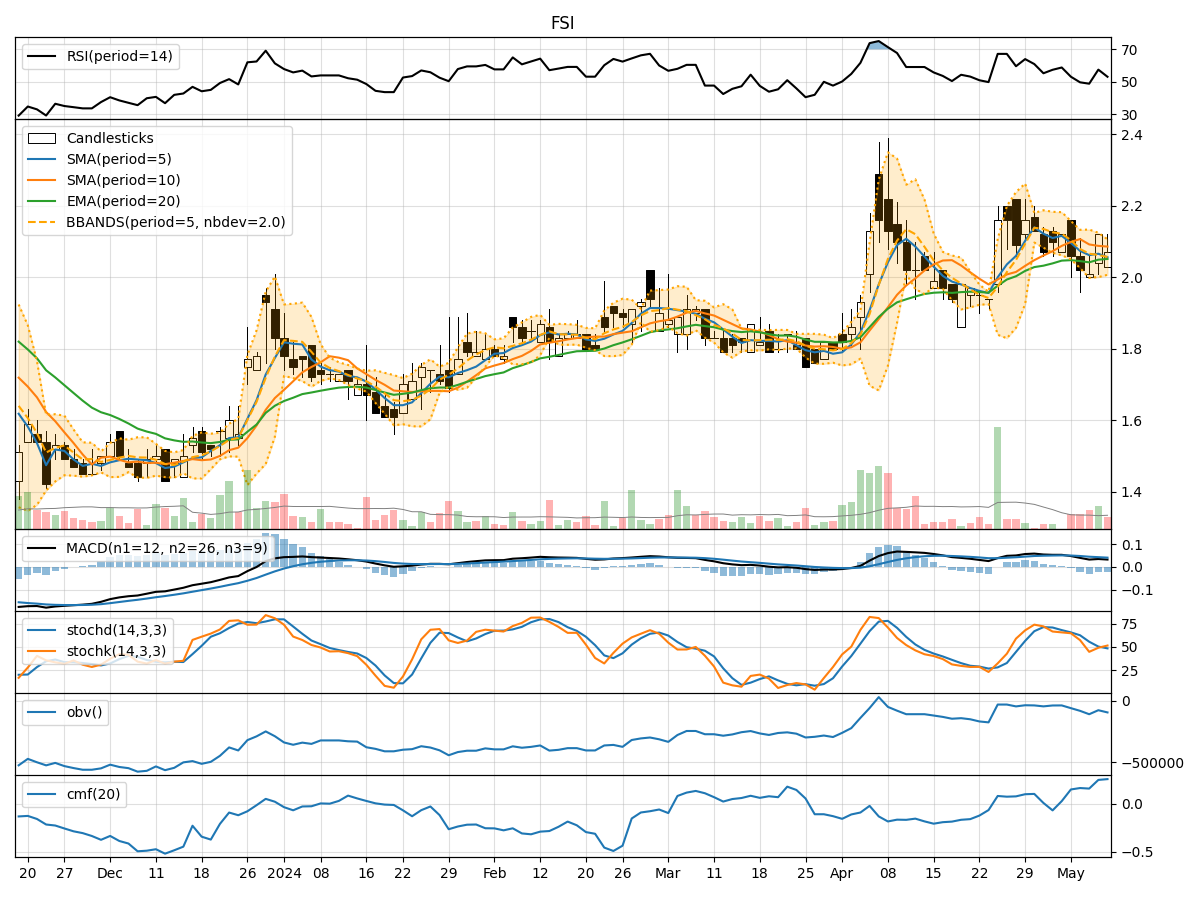
Technical Analysis of FSI 2024-05-10
Overview:
In analyzing the technical indicators for FSI stock over the last 5 days, we will delve into the trends, momentum, volatility, and volume aspects to provide a comprehensive outlook on the possible stock price movement in the coming days. By examining key indicators such as moving averages, MACD, RSI, Stochastic Oscillator, Bollinger Bands, and OBV, we aim to offer valuable insights and predictions for potential price action.
Trend Analysis:
- Moving Averages (MA): The 5-day MA has been fluctuating around the closing prices, indicating a lack of clear trend direction.
- MACD: The MACD line has been positive but decreasing, suggesting a potential slowdown in bullish momentum.
- EMA: The EMA has been relatively stable, reflecting a moderate trend in the stock price.
Momentum Analysis:
- RSI: The RSI has been oscillating around the 50 level, indicating a balanced momentum between buying and selling pressure.
- Stochastic Oscillator: Both %K and %D have been hovering in the neutral zone, signaling a lack of strong momentum in either direction.
Volatility Analysis:
- Bollinger Bands: The stock price has been trading within the bands, with the width of the bands narrowing, suggesting a decrease in volatility.
- Bollinger Band %B: The %B indicator has been fluctuating around the midline, indicating a balanced volatility level.
Volume Analysis:
- On-Balance Volume (OBV): The OBV has shown mixed movements, reflecting indecision among market participants regarding the stock.
- Chaikin Money Flow (CMF): The CMF has been positive but relatively flat, indicating stable buying pressure.
Key Observations:
- The stock is currently in a consolidation phase with no clear trend direction.
- Momentum indicators suggest a lack of strong buying or selling pressure in the market.
- Volatility has been decreasing, indicating a potential period of price stability.
- Volume indicators show mixed signals regarding market sentiment.
Conclusion:
Based on the analysis of the technical indicators, the next few days for FSI stock are likely to see sideways movement with limited price fluctuations. Traders and investors may expect the stock to continue trading within a narrow range as it consolidates before a potential breakout. It is advisable to closely monitor key support and resistance levels for any signs of a trend reversal.