Technical Analysis of GLDG 2024-05-10
Overview:
In analyzing the technical indicators for GLDG over the last 5 days, we will delve into the trend, momentum, volatility, and volume indicators to provide a comprehensive outlook on the possible stock price movement in the coming days. By examining these key aspects, we aim to offer valuable insights and recommendations for potential investors.
Trend Analysis:
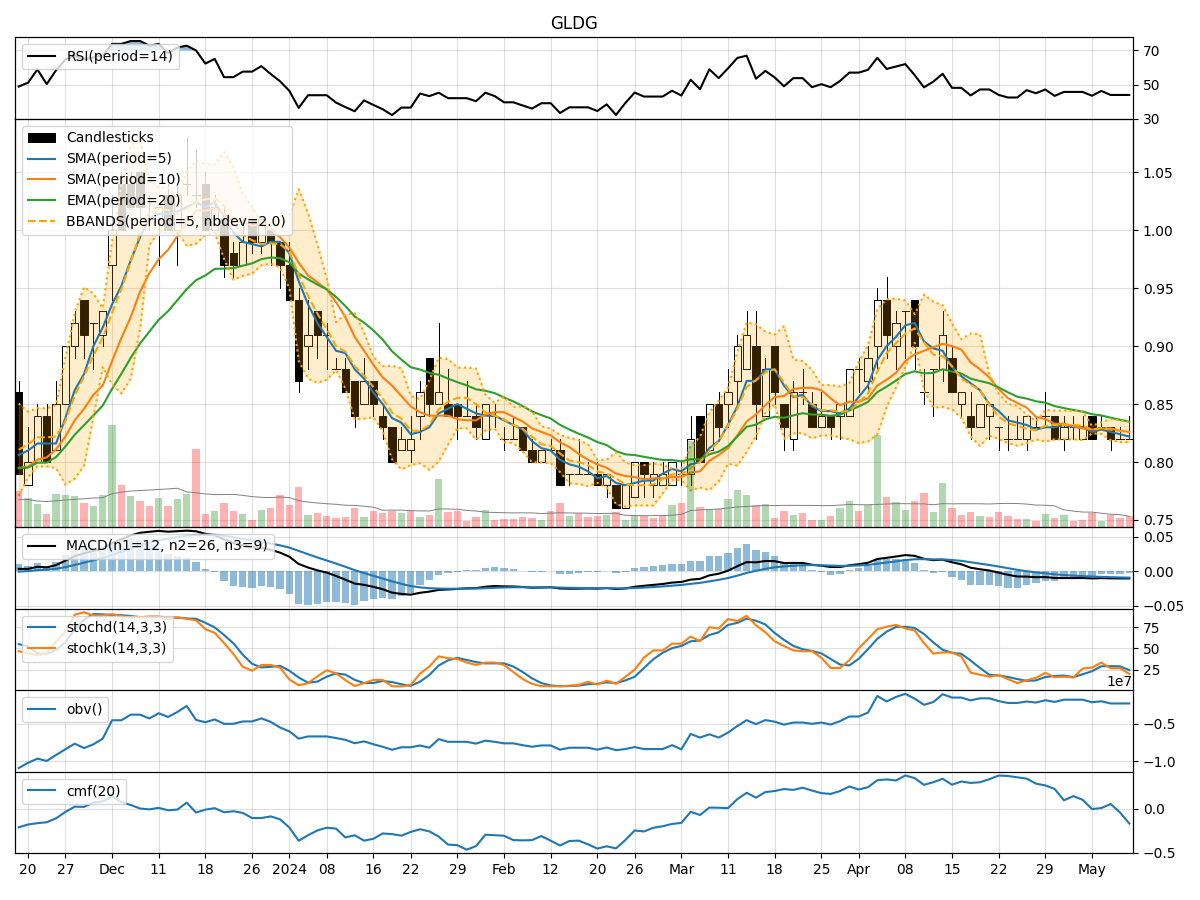
- Moving Averages (MA): The 5-day MA has been consistently below the short-term (10-day) SMA, indicating a short-term bearish trend.
- Exponential Moving Average (EMA): The EMA(20) has been declining, suggesting a bearish sentiment in the medium to long term.
- Moving Average Convergence Divergence (MACD): The MACD line has been negative, with the MACD histogram showing a decreasing trend, signaling bearish momentum.
Momentum Analysis:
- Relative Strength Index (RSI): The RSI has been hovering around the mid-range, indicating a lack of strong momentum in either direction.
- Stochastic Oscillator: Both %K and %D have been relatively low, suggesting a potential oversold condition.
- Williams %R (WillR): The WillR indicator has consistently been in the oversold territory, indicating a bearish sentiment.
Volatility Analysis:
- Bollinger Bands (BB): The stock price has been trading within the lower Bollinger Band, indicating a period of low volatility.
- Bollinger Band Width (BBW): The BBW has been narrowing, suggesting a potential decrease in volatility.
- Bollinger Band %B (BBP): The %B indicator has been below 0.2, indicating an oversold condition.
Volume Analysis:
- On-Balance Volume (OBV): The OBV has been relatively flat, indicating a balance between buying and selling pressure.
- Chaikin Money Flow (CMF): The CMF(20) has been negative, suggesting a bearish money flow trend.
Conclusion:
Based on the analysis of the technical indicators, the overall outlook for GLDG in the next few days is bearish. The trend indicators, momentum oscillators, volatility measures, and volume indicators collectively point towards a continuation of the current downward trend. The stock is likely to experience further downside pressure, potentially leading to lower price levels in the near term. Traders and investors should exercise caution and consider shorting or staying on the sidelines until a clear reversal pattern emerges.
Key Takeaways:
- Direction: Downward
- Recommendation: Bearish
- Action: Consider short positions or wait for a confirmed reversal signal before considering long positions.
- Risk Management: Set stop-loss orders to manage downside risk effectively.
- Monitoring: Keep a close eye on key support levels and any potential reversal patterns that may signal a change in trend.
By staying informed and monitoring the evolving market dynamics, investors can make well-informed decisions aligned with the prevailing technical indicators and market sentiment.