Technical Analysis of GORO 2024-05-10
Overview:
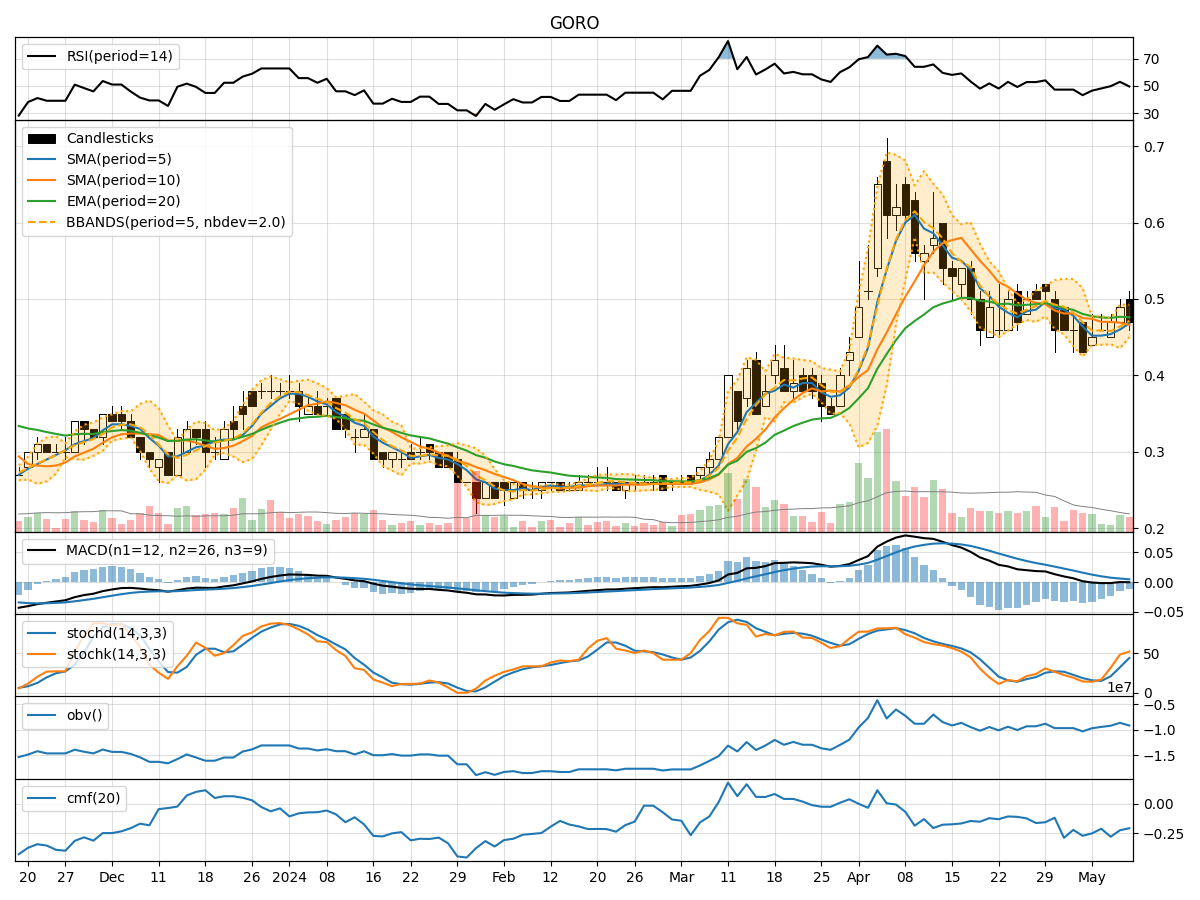
In analyzing the technical indicators for GORO over the last 5 days, we will delve into the trend, momentum, volatility, and volume indicators to provide a comprehensive outlook on the possible stock price movement. By examining these key aspects, we aim to offer valuable insights and predictions for the upcoming days.
Trend Analysis:
- Moving Averages (MA): The 5-day Moving Average (MA) has shown a slight increase from 0.452 to 0.468, indicating a positive trend in the short term.
- MACD and Signal Line: The MACD line has been fluctuating around 0, suggesting a lack of strong momentum in either direction.
- EMA: The Exponential Moving Average (EMA) has been relatively stable around 0.475, indicating a consolidation phase.
Momentum Analysis:
- RSI: The Relative Strength Index (RSI) has been hovering around 50, indicating a neutral momentum with no clear overbought or oversold conditions.
- Stochastic Oscillator: The Stochastic Oscillator has shown mixed signals, with the %K line crossing the %D line, suggesting potential indecision in the market.
- Williams %R: The Williams %R indicator has been fluctuating between oversold and neutral levels, reflecting uncertainty in price direction.
Volatility Analysis:
- Bollinger Bands: The Bollinger Bands have widened slightly, indicating increased volatility in the stock price.
- Bollinger %B: The %B indicator has fluctuated within the bands, suggesting potential price reversals or breakouts.
Volume Analysis:
- On-Balance Volume (OBV): The OBV has shown a slight decrease, indicating some selling pressure in the market.
- Chaikin Money Flow (CMF): The CMF has been negative, signaling a lack of buying interest in the stock.
Key Observations:
- The stock is currently in a consolidation phase with mixed signals from various indicators.
- The lack of strong momentum and conflicting signals from oscillators indicate indecision among traders.
- Volatility has increased slightly, suggesting potential price swings in the near term.
- The negative CMF and decreasing OBV point towards a bearish sentiment in the market.
Conclusion:
Based on the analysis of the technical indicators, the stock price of GORO is likely to experience further downside movement in the next few days. The lack of clear trend direction, mixed momentum signals, and bearish volume indications suggest that the stock may continue its consolidation or downward trend. Traders should exercise caution and consider short-term selling strategies or wait for more definitive signals before entering new positions.