Technical Analysis of GROY 2024-05-10
Overview:
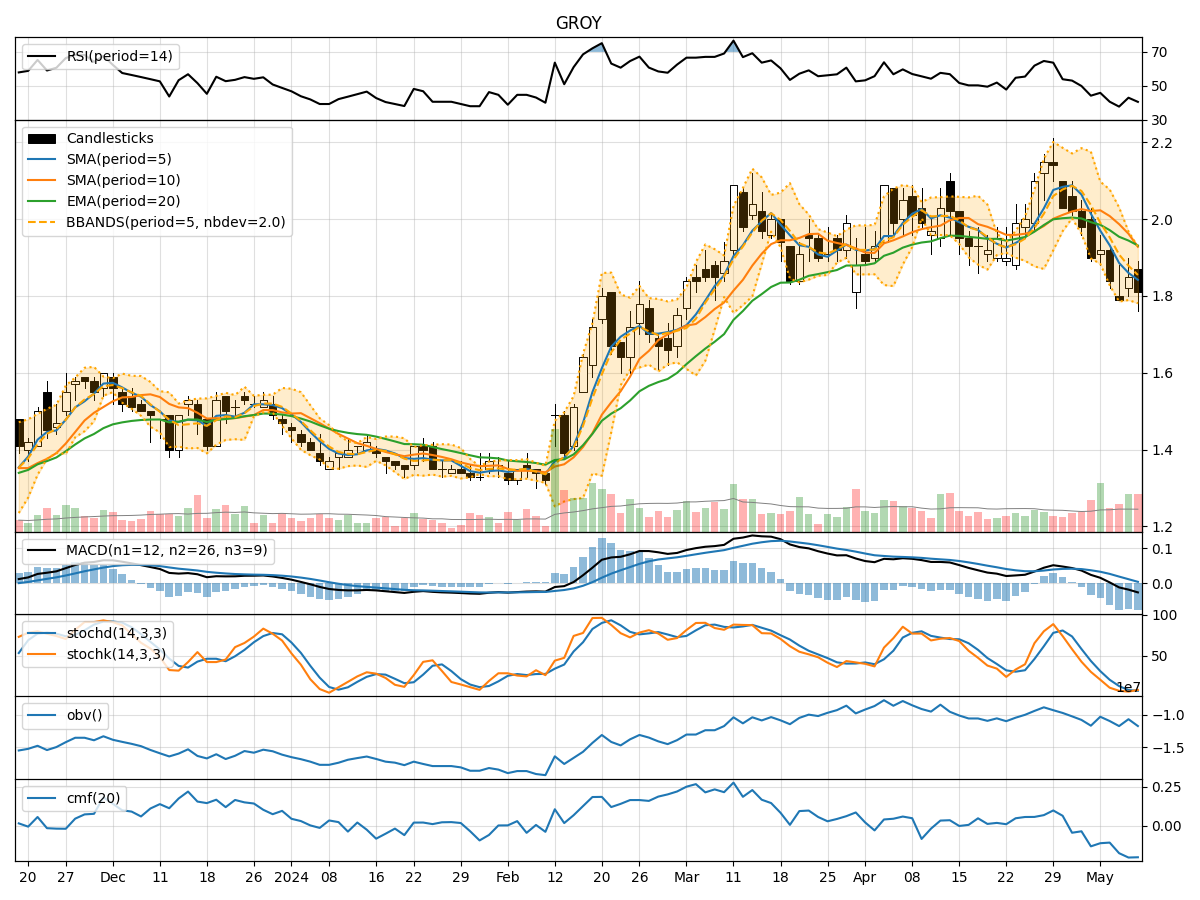
In analyzing the technical indicators for GROY over the last 5 days, we will delve into the trends, momentum, volatility, and volume aspects to provide a comprehensive outlook on the possible stock price movement. By examining key indicators such as moving averages, MACD, RSI, Bollinger Bands, and OBV, we aim to offer valuable insights and predictions for the upcoming days.
Trend Analysis:
- Moving Averages (MA): The 5-day MA has been consistently decreasing, indicating a downward trend in the stock price.
- MACD: The MACD line has been below the signal line for the past 5 days, suggesting bearish momentum.
Momentum Analysis:
- RSI: The RSI has been hovering around 40-45, indicating a neutral to slightly bearish momentum.
- Stochastic Oscillator: Both %K and %D have been relatively low, signaling potential oversold conditions.
Volatility Analysis:
- Bollinger Bands (BB): The stock price has been trading below the lower Bollinger Band, indicating oversold conditions.
Volume Analysis:
- On-Balance Volume (OBV): The OBV has been declining, reflecting selling pressure in the stock.
Key Observations:
- The stock is currently in a downtrend based on moving averages and MACD.
- Momentum indicators suggest a neutral to slightly bearish sentiment.
- Volatility indicators point towards oversold conditions.
- Declining OBV indicates selling pressure in the stock.
Conclusion:
Based on the technical analysis of GROY, the stock is likely to experience further downside movement in the next few days. The combination of a downtrend in moving averages, bearish MACD, neutral RSI, oversold stochastic levels, trading below the lower Bollinger Band, and declining OBV all point towards a continuation of the current bearish trend. Investors should exercise caution and consider waiting for signs of a reversal before considering any long positions.