Technical Analysis of LPA 2024-05-10
Overview:
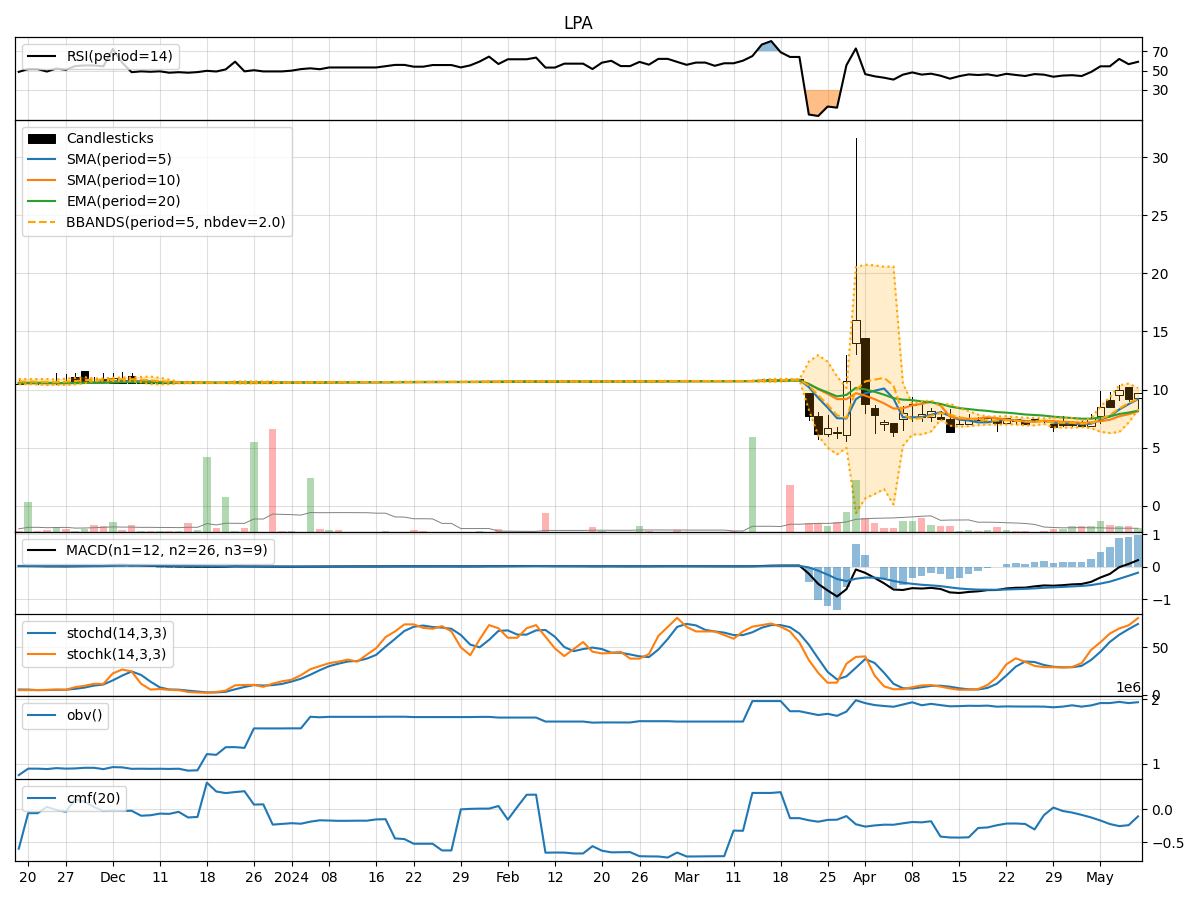
In analyzing the technical indicators for the last 5 days of LPA stock, we will delve into the trend, momentum, volatility, and volume indicators to provide a comprehensive outlook on the possible stock price movement in the coming days. By examining these key aspects, we aim to offer valuable insights and predictions to guide your investment decisions.
Trend Indicators:
- Moving Averages (MA): The moving averages have been showing an upward trend, with the 5-day MA consistently above the longer-term SMAs and EMAs. This indicates a bullish momentum in the short term.
- MACD: The MACD line has been consistently above the signal line, with both lines trending upwards. This suggests a strengthening bullish momentum.
- MACD Histogram: The MACD histogram has been increasing, indicating an acceleration in the bullish momentum.
Momentum Indicators:
- RSI: The RSI has been fluctuating around the 50 level, indicating a neutral momentum in the stock.
- Stochastic Oscillator: The stochastic indicators have been in the overbought territory, suggesting a potential reversal or consolidation in the stock price.
- Williams %R: The Williams %R has been hovering around the oversold territory, indicating a potential buying opportunity.
Volatility Indicators:
- Bollinger Bands: The Bollinger Bands have been widening, indicating increased volatility in the stock price. The upper band has been breached, suggesting a potential overbought condition.
- Bollinger %B: The %B indicator has been fluctuating, indicating potential reversal points in the stock price.
Volume Indicators:
- On-Balance Volume (OBV): The OBV has been relatively flat, suggesting a balance between buying and selling pressure.
- Chaikin Money Flow (CMF): The CMF has been negative, indicating a lack of buying pressure in the stock.
Key Observations and Opinions:
- Trend: The stock is currently in an upward trend based on moving averages and MACD indicators.
- Momentum: The momentum is neutral to slightly bearish based on RSI and stochastic indicators.
- Volatility: Volatility has increased, suggesting potential price swings in the coming days.
- Volume: The volume indicators show a lack of significant buying pressure.
Conclusion:
Based on the analysis of the technical indicators, the stock is likely to experience sideways consolidation in the near term. The bullish trend indicated by moving averages and MACD may face resistance due to neutral momentum and lack of significant buying pressure. Traders should exercise caution and wait for clearer signals before making any significant trading decisions.