Technical Analysis of MAG 2024-05-10
Overview:
In analyzing the technical indicators for MAG stock over the last 5 days, we will delve into the trend, momentum, volatility, and volume indicators to provide a comprehensive outlook on the possible stock price movement in the coming days. By examining these key indicators, we aim to offer valuable insights and predictions to guide your investment decisions.
Trend Analysis:
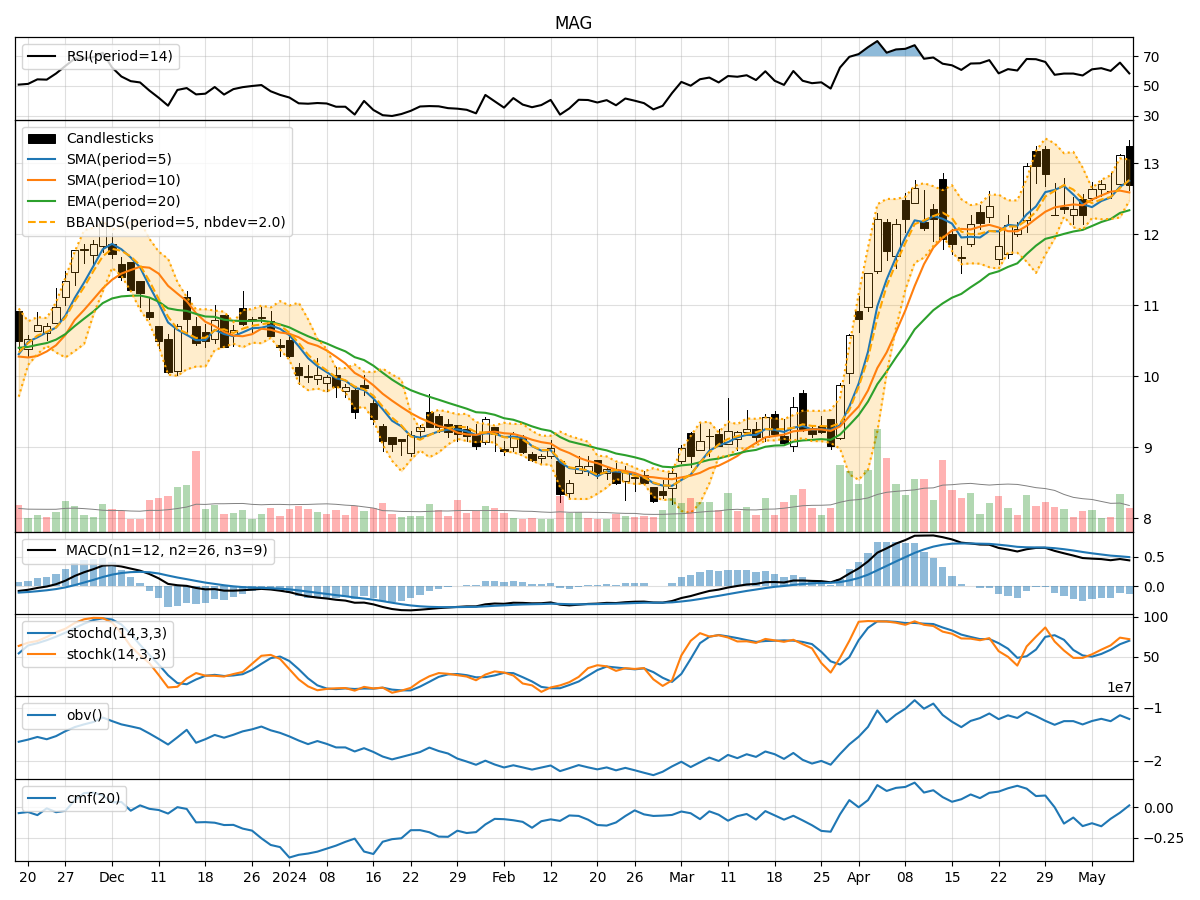
- Moving Averages (MA): The 5-day Moving Average (MA) has been showing an upward trend, indicating a positive momentum in the stock price.
- MACD: The Moving Average Convergence Divergence (MACD) has been consistently positive, suggesting a bullish trend in the stock.
- EMA: The Exponential Moving Average (EMA) has been steadily increasing, supporting the bullish sentiment in the stock.
Momentum Analysis:
- RSI: The Relative Strength Index (RSI) has been fluctuating but generally staying within the neutral to slightly overbought territory, indicating a balanced momentum.
- Stochastic Oscillator: Both %K and %D have been in the overbought zone, suggesting a potential reversal or consolidation in the stock price.
- Williams %R: The Williams %R is in the oversold region, indicating a possible buying opportunity.
Volatility Analysis:
- Bollinger Bands: The Bollinger Bands are narrowing, indicating decreasing volatility in the stock price.
- Bollinger %B: The %B indicator is below 1, suggesting the stock is trading below the lower Bollinger Band, potentially indicating an oversold condition.
Volume Analysis:
- On-Balance Volume (OBV): The OBV has been fluctuating, indicating mixed buying and selling pressure in the stock.
- Chaikin Money Flow (CMF): The CMF has been negative, suggesting a bearish sentiment in the stock.
Conclusion:
Based on the analysis of the technical indicators, the stock of MAG is likely to experience sideways consolidation in the coming days. The trend indicators point towards a bullish sentiment, supported by the positive MACD and EMA. However, the momentum indicators suggest a potential reversal or consolidation phase, as the stochastic oscillator is in the overbought zone and the RSI is hovering around neutral levels. The volatility indicators indicate decreasing volatility, which aligns with the consolidation view. The volume indicators show mixed signals, with the OBV fluctuating and the CMF indicating a bearish sentiment.
In conclusion, while there are bullish indications in the trend analysis, the momentum and volume indicators suggest a possible consolidation phase. Therefore, it is recommended to exercise caution and closely monitor the stock price movement in the coming days before making any investment decisions.