Technical Analysis of MRT 2024-05-10
Overview:
In analyzing the technical indicators for MRT stock over the last 5 days, we will delve into the trend, momentum, volatility, and volume indicators to provide a comprehensive outlook on the possible stock price movement in the coming days. By examining these key indicators, we aim to offer valuable insights and predictions for potential investors.
Trend Indicators:
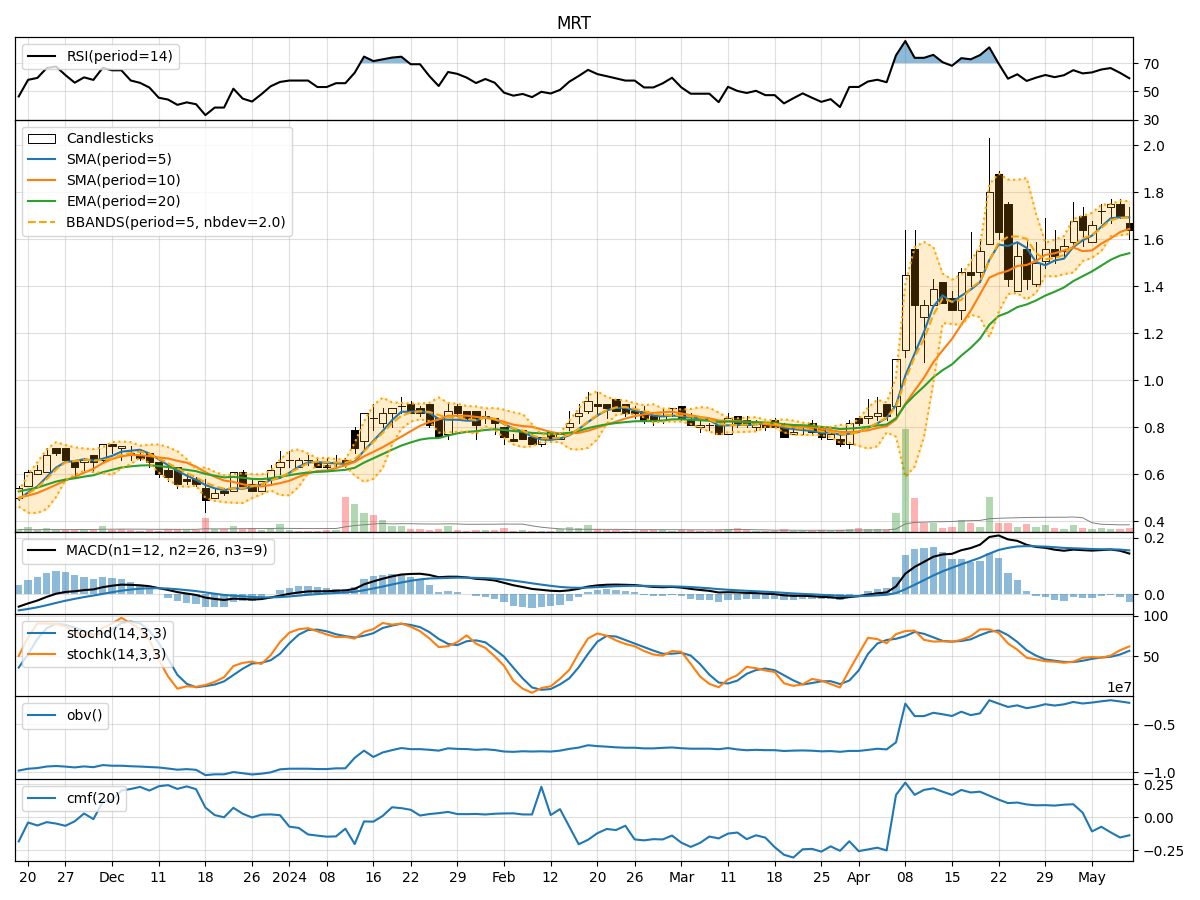
- Moving Averages (MA): The 5-day moving average has been steadily increasing, indicating a positive trend in the stock price.
- MACD: The MACD line has been consistently above the signal line, suggesting bullish momentum in the stock.
- EMA: The exponential moving average has been on an upward trajectory, supporting the bullish sentiment in the stock.
Momentum Indicators:
- RSI: The Relative Strength Index has been fluctuating but generally staying within the neutral range, indicating a balanced momentum in the stock.
- Stochastic Oscillator: Both %K and %D lines have been trending upwards, reflecting increasing buying pressure in the stock.
- Williams %R: The Williams %R is approaching oversold levels, suggesting a potential reversal in the stock price.
Volatility Indicators:
- Bollinger Bands: The Bollinger Bands have been narrowing, indicating decreasing volatility in the stock.
- Bollinger %B: The %B indicator is hovering around the middle range, signifying a neutral stance in terms of volatility.
Volume Indicators:
- On-Balance Volume (OBV): The OBV has been fluctuating but not showing a clear trend, indicating mixed sentiment among investors.
- Chaikin Money Flow (CMF): The CMF has been negative, suggesting that money may be flowing out of the stock.
Key Observations:
- The trend indicators suggest a bullish sentiment in the stock, supported by the moving averages and MACD.
- Momentum indicators show a mixed picture, with RSI indicating neutrality and stochastic oscillator hinting at potential buying pressure.
- Volatility indicators point towards decreasing volatility, which may lead to a period of consolidation.
- Volume indicators reflect mixed sentiment among investors, with money flowing out of the stock according to the CMF.
Conclusion:
Based on the analysis of the technical indicators, the stock is likely to experience a period of consolidation in the coming days. The bullish trend indicated by moving averages and MACD may be hindered by the neutral momentum and decreasing volatility. Investors should exercise caution and closely monitor the price action for any potential shifts in the market sentiment.