Technical Analysis of NG 2024-05-10
Overview:
In analyzing the technical indicators for NG stock over the last 5 days, we will delve into the trend, momentum, volatility, and volume indicators to provide a comprehensive outlook on the possible stock price movement in the coming days. By examining these key indicators, we aim to offer valuable insights and predictions to guide investment decisions.
Trend Analysis:
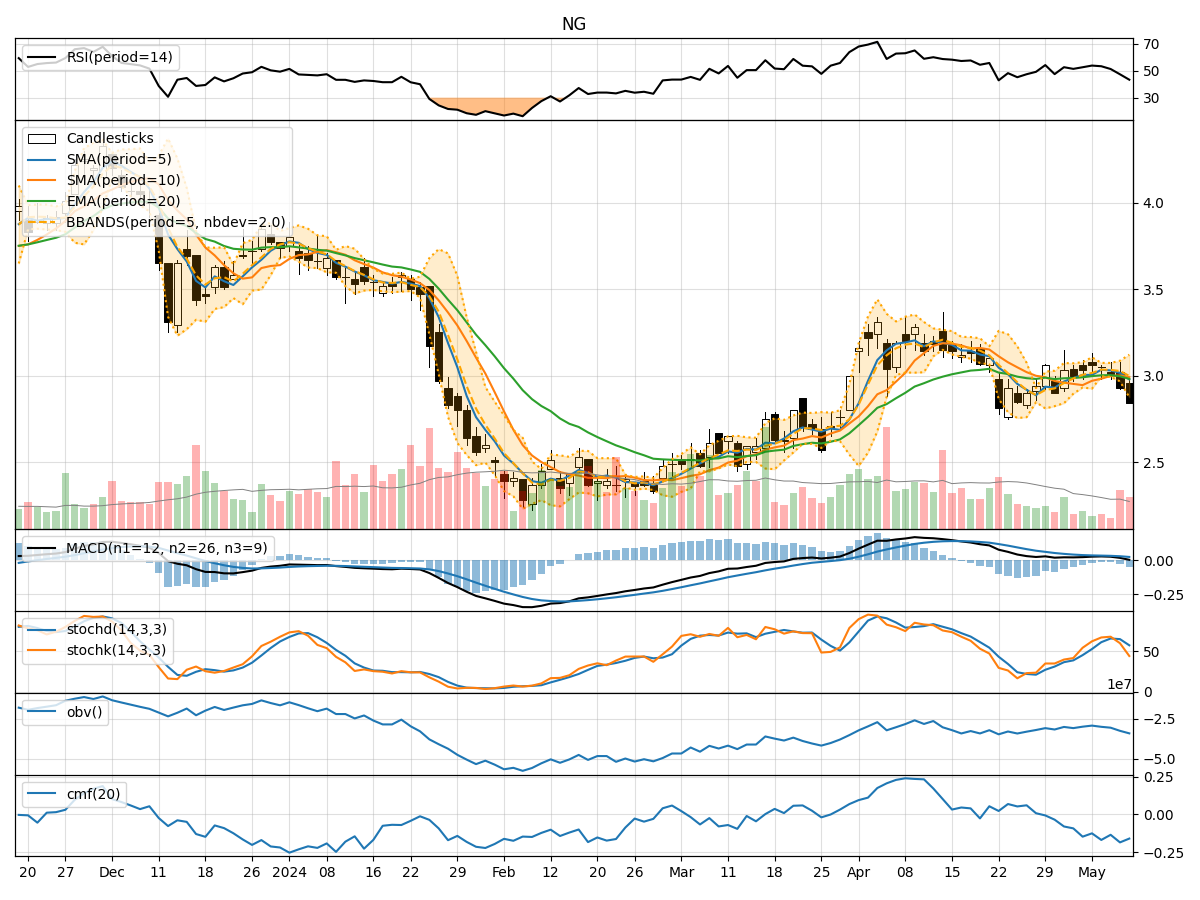
- Moving Averages (MA): The 5-day Moving Average (MA) has been fluctuating around the closing prices, indicating short-term price trends. The Simple Moving Average (SMA) and Exponential Moving Average (EMA) show a slight uptrend but with some volatility.
- MACD: The Moving Average Convergence Divergence (MACD) and its signal line (MACDh) have been positive, suggesting a bullish momentum in the short term.
Momentum Analysis:
- RSI: The Relative Strength Index (RSI) has been declining, indicating a weakening momentum in the stock price movement.
- Stochastic Oscillator: Both %K and %D have been decreasing, signaling a bearish momentum.
- Williams %R: The Williams %R is in oversold territory, suggesting a potential reversal or consolidation.
Volatility Analysis:
- Bollinger Bands (BB): The Bollinger Bands show a widening of the bands, indicating increased volatility in the stock price.
- Bollinger %B: The %B is below 1, suggesting the stock is trading below the lower band, potentially indicating an oversold condition.
Volume Analysis:
- On-Balance Volume (OBV): The OBV has been declining, indicating selling pressure and potential bearish sentiment.
- Chaikin Money Flow (CMF): The CMF is negative, indicating outflow of money from the stock.
Key Observations:
- The trend indicators show a mixed picture with some bullish signals from the MACD but volatility in moving averages.
- Momentum indicators suggest a bearish sentiment with declining RSI and stochastic oscillators.
- Volatility has increased, as seen in the widening Bollinger Bands, indicating potential price swings.
- Volume indicators reflect a negative sentiment with decreasing OBV and negative CMF.
Conclusion:
Based on the analysis of the technical indicators, the stock price of NG is likely to experience a downward movement in the coming days. The bearish momentum indicated by the RSI and stochastic oscillators, coupled with the negative volume indicators, suggests a potential continuation of the current downtrend. The increased volatility and oversold conditions further support a bearish outlook. Investors should exercise caution and consider short-term selling strategies until there are clear signs of a trend reversal.