Technical Analysis of OBE 2024-05-10
Overview:
In analyzing the technical indicators for OBE over the last 5 days, we will delve into the trend, momentum, volatility, and volume indicators to provide a comprehensive outlook on the possible stock price movement in the coming days. By examining these key indicators, we aim to offer valuable insights and predictions for informed decision-making.
Trend Analysis:
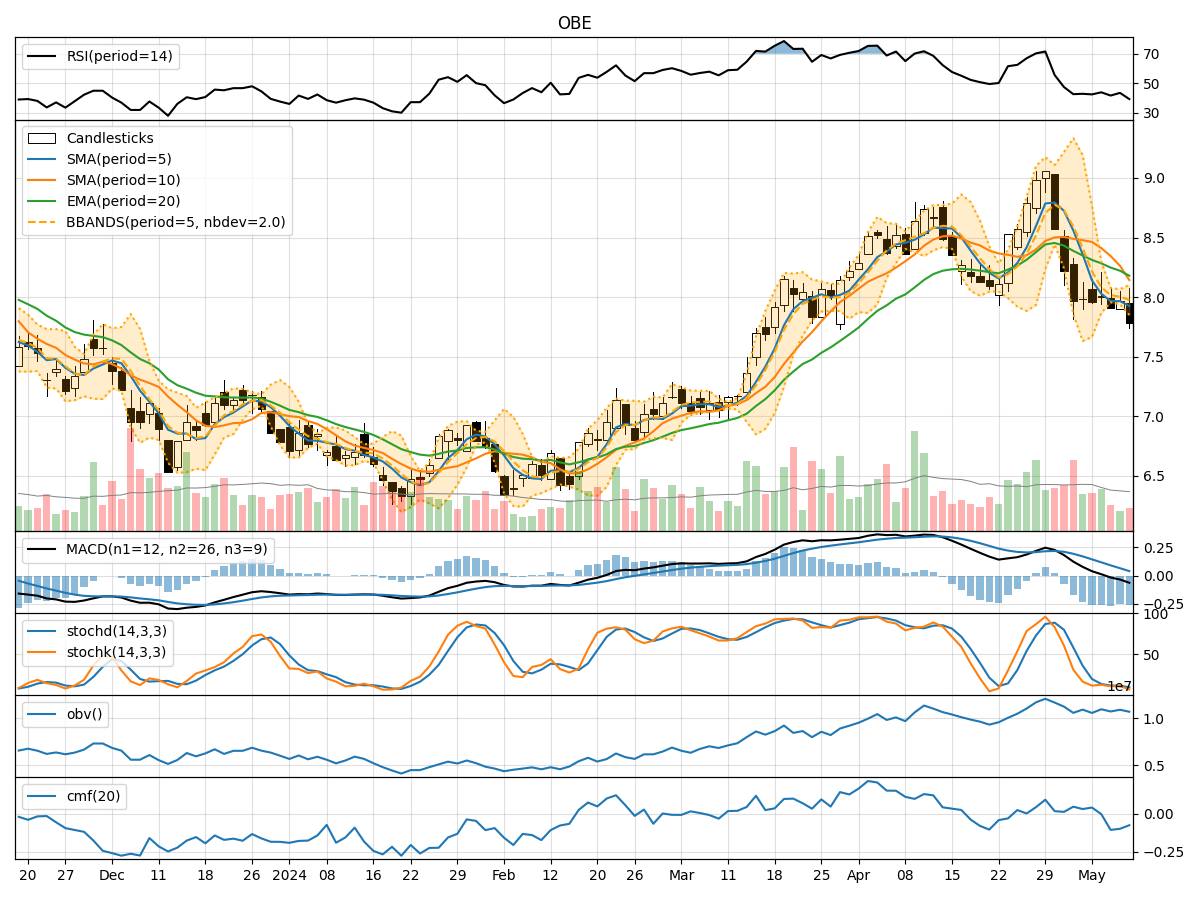
- Moving Averages (MA): The 5-day Moving Average (MA) has been consistently below the Simple Moving Average (SMA) and Exponential Moving Average (EMA), indicating a downward trend.
- MACD: The MACD line has been below the signal line, with negative values for MACD Histogram, suggesting bearish momentum.
Momentum Analysis:
- RSI: The Relative Strength Index (RSI) has been fluctuating around the 40-45 range, indicating a neutral to slightly bearish momentum.
- Stochastic Oscillator: Both %K and %D have been trending downwards, reflecting weakening momentum.
- Williams %R: The indicator has been in oversold territory, suggesting a potential reversal.
Volatility Analysis:
- Bollinger Bands (BB): The stock price has been consistently below the middle Bollinger Band (BBM), indicating a downtrend with low volatility.
- Bollinger %B: The %B value has been below 0.5, indicating the stock is trading below the lower Bollinger Band.
Volume Analysis:
- On-Balance Volume (OBV): The OBV has been relatively stable, showing no significant divergence.
- Chaikin Money Flow (CMF): The CMF has been negative, indicating selling pressure in the stock.
Key Observations:
- The trend indicators suggest a bearish sentiment with the stock price consistently below key moving averages.
- Momentum indicators point towards a weakening momentum, with oscillators signaling potential oversold conditions.
- Volatility indicators indicate low volatility and a downward trend in price movement.
- Volume indicators show a lack of significant divergence in volume, but the CMF reflects selling pressure.
Conclusion:
Based on the analysis of the technical indicators, the stock is likely to continue its downward movement in the coming days. The bearish trend, coupled with weakening momentum and low volatility, suggests a high probability of further price decline. Traders and investors should exercise caution and consider shorting or staying on the sidelines until a clear reversal pattern emerges.