Technical Analysis of SATX 2024-05-10
Overview:
In analyzing the technical indicators for SATX over the last 5 days, we will delve into the trend, momentum, volatility, and volume indicators to provide a comprehensive outlook on the possible stock price movement. By examining these key aspects, we aim to offer valuable insights and predictions for the upcoming days.
Trend Analysis:
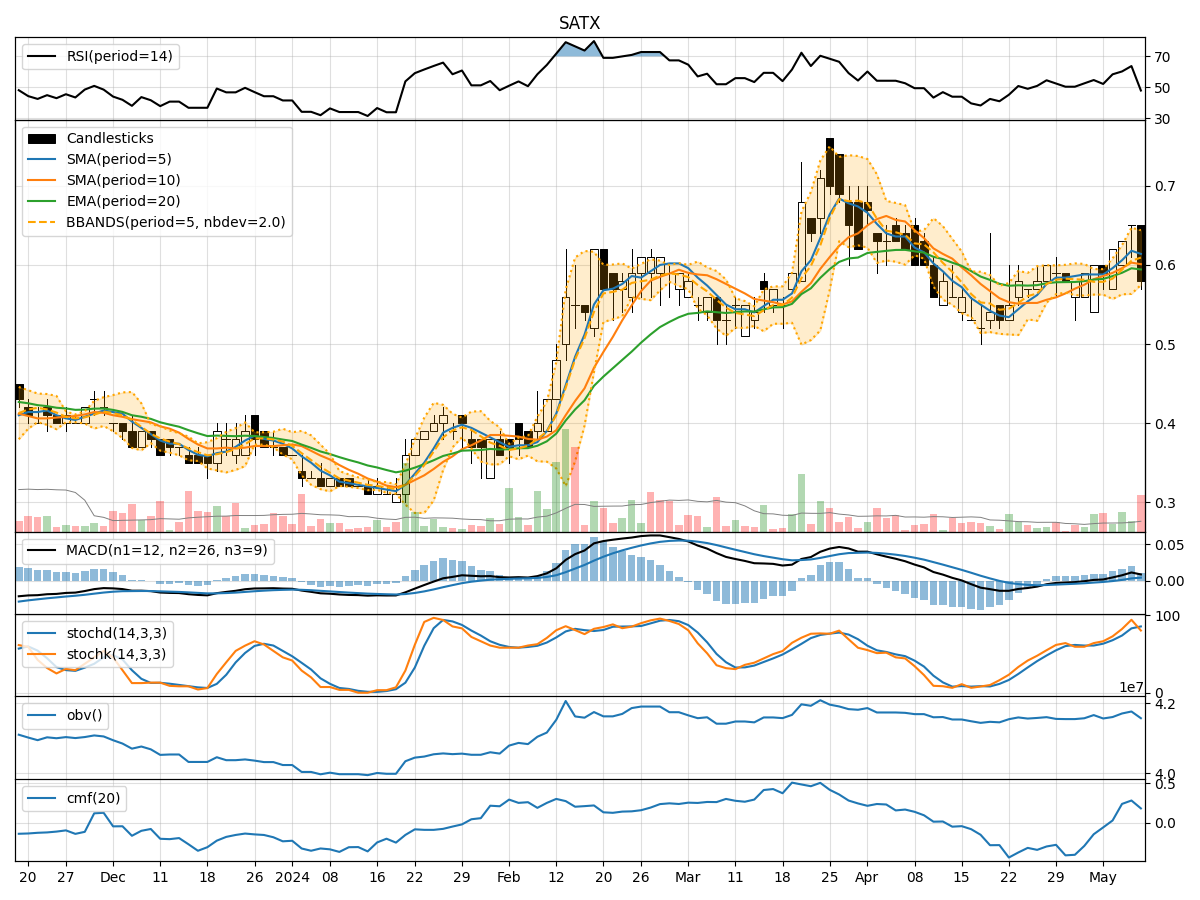
- Moving Averages (MA): The 5-day Moving Average (MA) has been showing an upward trend, indicating a positive momentum in the stock price.
- MACD: The Moving Average Convergence Divergence (MACD) has been consistently positive, suggesting a bullish trend in the stock.
- EMA: The Exponential Moving Average (EMA) has also been on the rise, further supporting the bullish sentiment in the short to medium term.
Momentum Analysis:
- RSI: The Relative Strength Index (RSI) has been fluctuating but generally staying within the neutral range, indicating a balanced momentum in the stock.
- Stochastic Oscillator: Both %K and %D values have been relatively high, signaling potential overbought conditions in the stock.
- Williams %R: The Williams %R is in the oversold territory, suggesting a possible reversal in the stock price.
Volatility Analysis:
- Bollinger Bands: The Bollinger Bands have been widening, indicating increased volatility in the stock price.
- Bollinger %B: The %B value has been fluctuating, suggesting potential price reversals or breakouts in the near future.
Volume Analysis:
- On-Balance Volume (OBV): The OBV has shown mixed signals, reflecting indecision among investors regarding the stock.
- Chaikin Money Flow (CMF): The CMF has been positive, indicating buying pressure in the stock.
Key Observations:
- The trend indicators suggest a bullish sentiment in the stock, supported by positive MA, MACD, and EMA values.
- Momentum indicators show a mixed picture with RSI in a neutral zone, Stochastic Oscillator indicating overbought conditions, and Williams %R signaling a possible reversal.
- Volatility indicators point towards increased price fluctuations, potentially leading to significant movements.
- Volume indicators reflect a lack of clear direction, with OBV showing mixed signals and CMF indicating buying pressure.
Conclusion:
Based on the analysis of the technical indicators, the stock price of SATX is likely to experience increased volatility in the upcoming days. The bullish trend indicated by the moving averages and MACD suggests a potential upward movement in the stock price. However, the momentum indicators showing overbought conditions and potential reversals, coupled with the mixed volume signals, indicate a need for caution.
Recommendation:
Considering the overall analysis, it is advisable for investors to monitor the stock closely for any signs of reversal or breakout. Risk management strategies should be employed to mitigate potential losses in case of unexpected price movements. Additionally, staying informed about market news and developments that could impact the stock price is crucial for making well-informed investment decisions.