Technical Analysis of SIM 2024-05-10
Overview:
In analyzing the technical indicators for SIM stock over the last 5 days, we will delve into the trend, momentum, volatility, and volume indicators to provide a comprehensive outlook on the possible stock price movement in the coming days. By examining these key indicators, we aim to offer valuable insights and predictions for potential investors.
Trend Analysis:
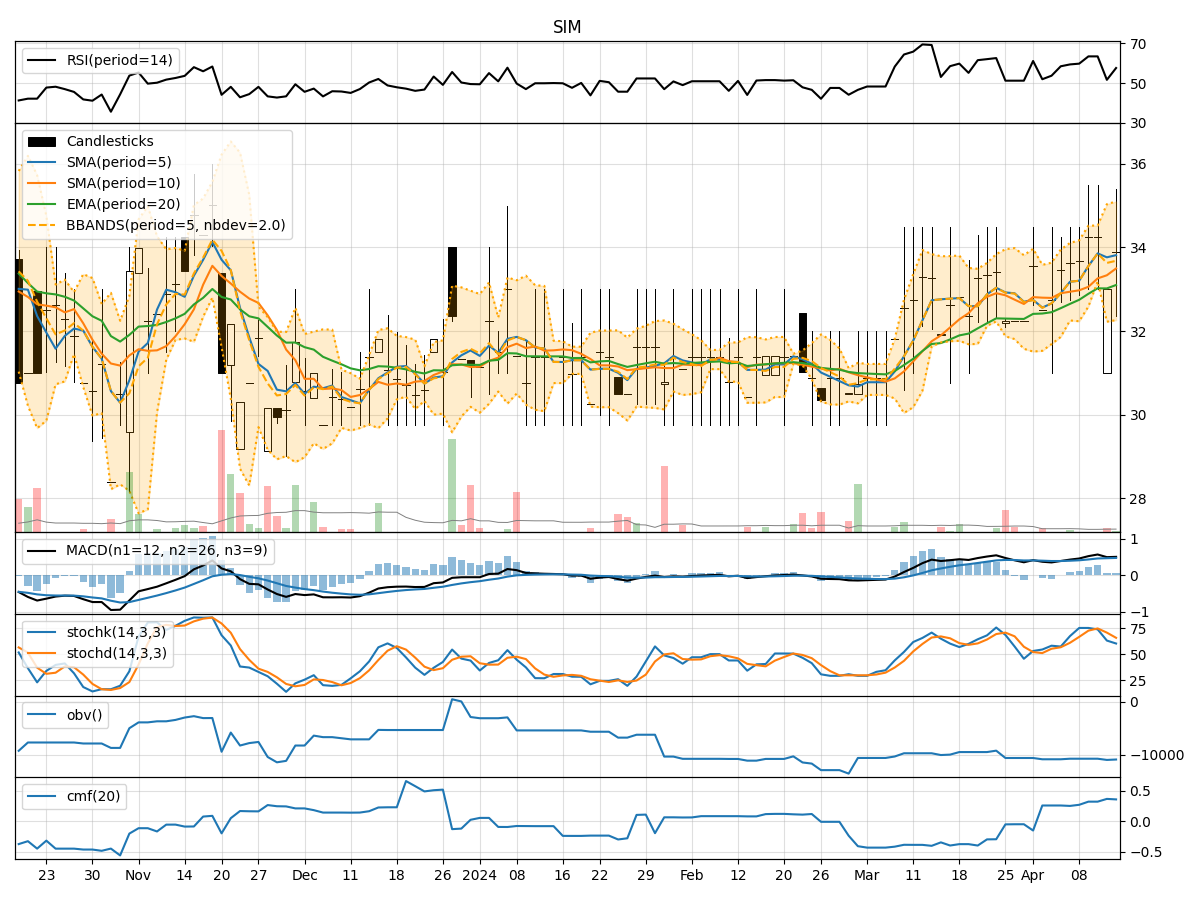
- Moving Averages (MA): The 5-day Moving Average (MA) has been fluctuating around the closing prices, indicating short-term price trends. The Simple Moving Average (SMA) and Exponential Moving Average (EMA) show a slight uptrend, suggesting a positive momentum.
- MACD: The Moving Average Convergence Divergence (MACD) has been positive, with the MACD line consistently above the signal line. This indicates a bullish trend in the stock price.
- Conclusion: The trend indicators suggest an upward momentum in the stock price.
Momentum Analysis:
- RSI: The Relative Strength Index (RSI) has been hovering around the neutral zone, indicating a balanced momentum between buying and selling pressure.
- Stochastic Oscillator: Both %K and %D lines of the Stochastic Oscillator are in the overbought territory, suggesting a potential reversal or consolidation.
- Conclusion: The momentum indicators signal a potential consolidation or reversal in the stock price.
Volatility Analysis:
- Bollinger Bands (BB): The Bollinger Bands have been widening, indicating increased volatility in the stock price. The price has been fluctuating within the bands, suggesting potential price swings.
- Conclusion: The volatility indicators point towards increased price volatility in the coming days.
Volume Analysis:
- On-Balance Volume (OBV): The OBV has been relatively stable, indicating a balance between buying and selling pressure.
- Chaikin Money Flow (CMF): The CMF has been positive, suggesting a net inflow of money into the stock.
- Conclusion: The volume indicators imply neutral sentiment in terms of buying and selling pressure.
Overall Conclusion:
Based on the analysis of the technical indicators, the stock of SIM is likely to experience increased volatility in the coming days, potentially leading to price swings within an upward trending market. However, the momentum indicators signal a possible consolidation or reversal in the short term due to overbought conditions.
Recommendation:
- Investors should closely monitor the price movements within the widening Bollinger Bands and be prepared for potential swings.
- Consider taking profits if the stock price reaches overbought levels based on the Stochastic Oscillator.
- Keep an eye on the OBV and CMF for any significant shifts in buying or selling pressure.
In conclusion, while the overall trend is bullish, caution is advised due to the potential for consolidation or reversal in the short term. Conducting further analysis and staying updated on market developments will be crucial for making informed investment decisions.