Technical Analysis of SVM 2024-05-10
Overview:
In analyzing the technical indicators for the stock based on the last 5 days of data, we will delve into the trend, momentum, volatility, and volume indicators to provide insights into the possible future stock price movement. By examining these key indicators, we aim to offer a comprehensive analysis and make informed predictions regarding the stock's potential direction in the upcoming days.
Trend Analysis:
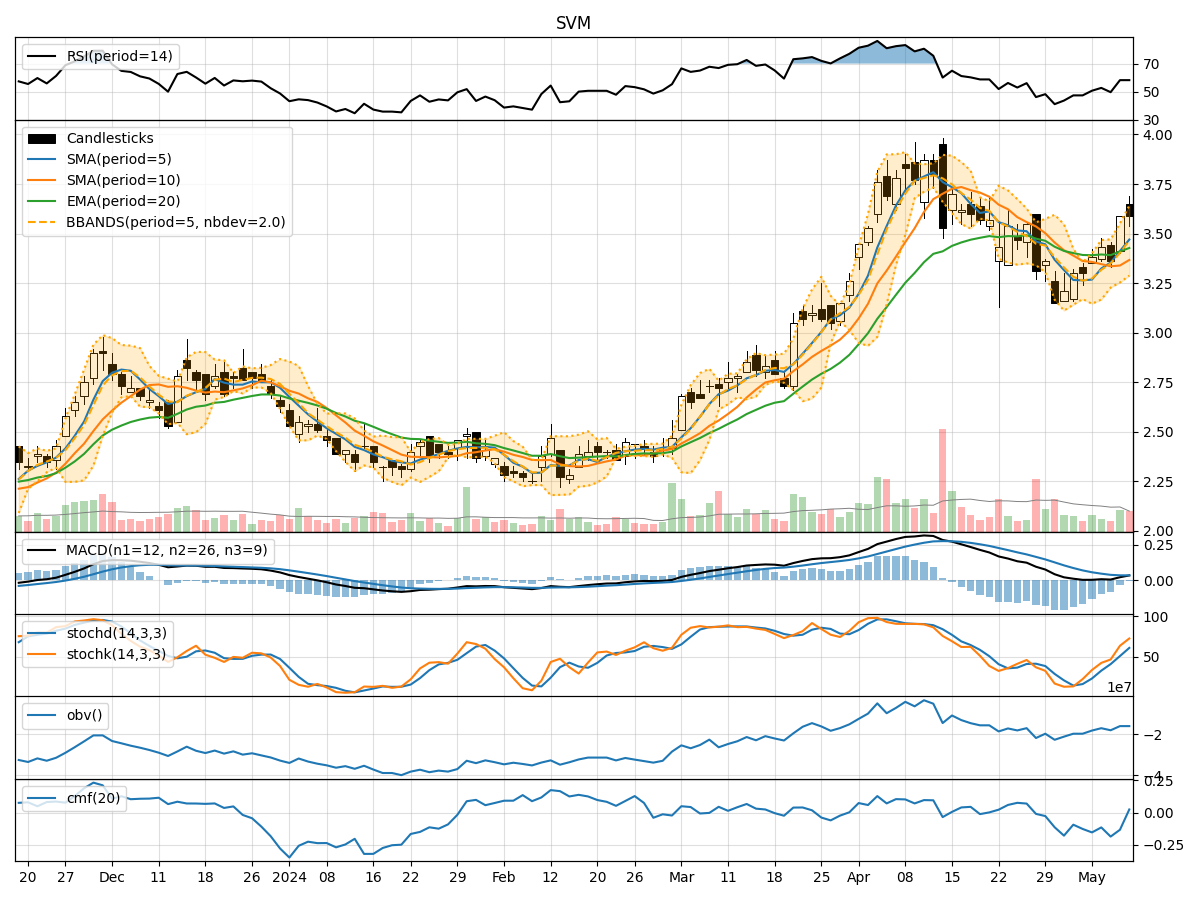
- Moving Averages (MA): The 5-day Moving Average (MA) has been showing an upward trend, indicating a positive momentum in the stock price.
- MACD (Moving Average Convergence Divergence): The MACD line has been consistently above the signal line, suggesting a bullish trend in the stock.
- EMA (Exponential Moving Average): The EMA has been trending upwards, further supporting the bullish sentiment in the stock.
Key Observation: The trend indicators point towards a bullish outlook for the stock.
Momentum Analysis:
- RSI (Relative Strength Index): The RSI has been fluctuating around the 50 level, indicating a neutral momentum in the stock.
- Stochastic Oscillator: Both %K and %D lines of the Stochastic Oscillator have been in the overbought zone, suggesting a potential reversal in the stock price.
- Williams %R (Willams Percentage Range): The Williams %R is in the oversold territory, signaling a possible buying opportunity.
Key Observation: The momentum indicators suggest a mixed sentiment with a slight bearish bias.
Volatility Analysis:
- Bollinger Bands (BB): The Bollinger Bands have been widening, indicating increased volatility in the stock price.
- Bollinger Band %B (BB %B): The %B value has been fluctuating, reflecting the volatility in the stock.
- Average True Range (ATR): The ATR value has been increasing, signifying higher volatility in the stock.
Key Observation: The volatility indicators point towards increased volatility in the stock.
Volume Analysis:
- On-Balance Volume (OBV): The OBV has been relatively stable, suggesting a balance between buying and selling pressure in the stock.
- Chaikin Money Flow (CMF): The CMF has been negative, indicating a bearish money flow in the stock.
Key Observation: The volume indicators indicate a neutral to bearish sentiment in the stock.
Conclusion:
Based on the analysis of the technical indicators, the stock is likely to experience increased volatility in the upcoming days. While the trend indicators suggest a bullish outlook, the momentum indicators show a mixed sentiment with a slight bearish bias. The volume indicators lean towards a neutral to bearish sentiment. Therefore, considering all factors, the stock may exhibit upward movement with increased volatility and potential for a short-term correction. Investors should closely monitor the price action and key support/resistance levels for timely decision-making.