Technical Analysis of TGB 2024-05-10
Overview:
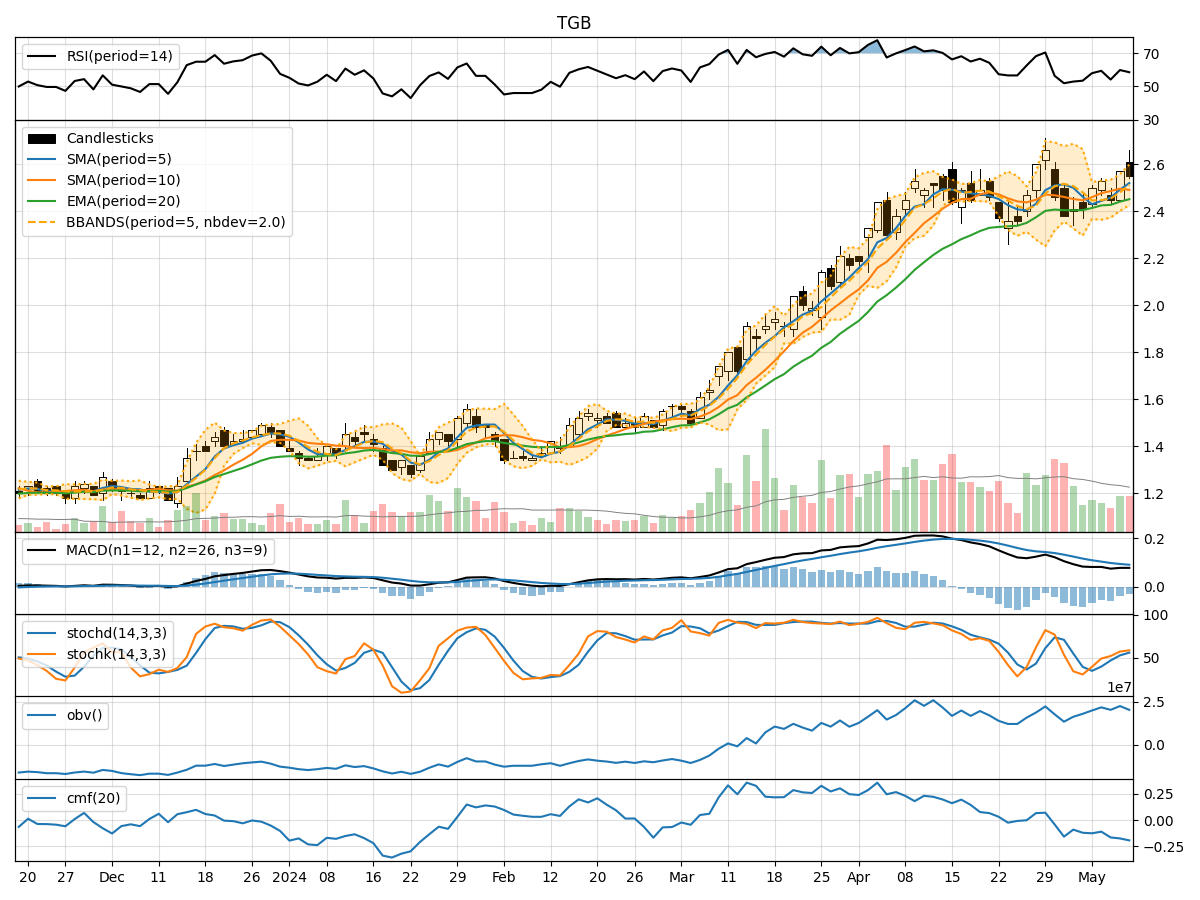
In analyzing the technical indicators for TGB over the last 5 days, we will delve into the trend, momentum, volatility, and volume indicators to provide a comprehensive outlook on the possible stock price movement in the coming days. By examining these key aspects, we aim to offer valuable insights and recommendations for potential investors.
Trend Analysis:
- Moving Averages (MA): The 5-day Moving Average (MA) has been consistently increasing, indicating a bullish trend in the short term.
- MACD and Signal Line: The MACD line has been positive, staying above the signal line, suggesting a bullish momentum.
- Relative Strength Index (RSI): RSI has been fluctuating around the 50 level, indicating a neutral stance in terms of momentum.
Momentum Analysis:
- Stochastic Oscillator: Both %K and %D lines of the Stochastic Oscillator have been trending upwards, signaling a bullish momentum.
- Williams %R (WillR): The Williams %R indicator has been hovering in the oversold territory, suggesting a potential reversal in the short term.
Volatility Analysis:
- Bollinger Bands (BB): The stock price has been trading within the Bollinger Bands, with no significant breaches, indicating a stable price movement.
- Bollinger Band Width (BBW): The Band Width has been relatively narrow, suggesting low volatility in the stock.
Volume Analysis:
- On-Balance Volume (OBV): The OBV indicator has been fluctuating, indicating a balance between buying and selling pressure.
- Chaikin Money Flow (CMF): The CMF has been negative, suggesting a bearish sentiment in terms of volume flow.
Key Observations:
- The trend indicators point towards a bullish sentiment in the short term, supported by the positive MACD and increasing MA.
- Momentum indicators suggest a strengthening bullish momentum, especially with the Stochastic Oscillator showing upward trends.
- Volatility remains low, as indicated by the Bollinger Bands and Band Width, signaling a stable price movement.
- Volume indicators reflect a neutral to bearish sentiment, with the CMF indicating a negative volume flow.
Conclusion:
Based on the analysis of the technical indicators, the next few days' possible stock price movement for TGB is likely to be bullish. The trend and momentum indicators align in favor of an upward movement, supported by the positive MACD and Stochastic Oscillator. However, caution is advised due to the bearish volume sentiment indicated by the CMF. Traders and investors should closely monitor the price action and volume dynamics to confirm the bullish bias and consider potential entry or exit points accordingly.